banner 1

Wholesale 1000 × 1000 gym rubber tiles from Manufacturers

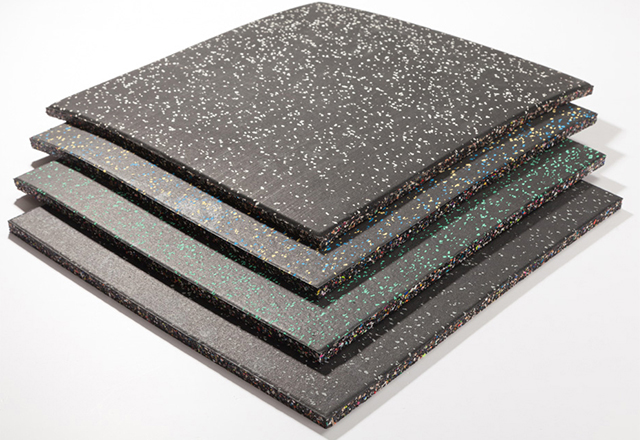
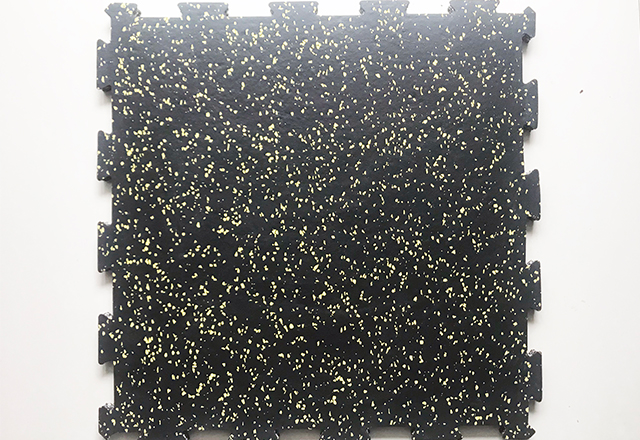
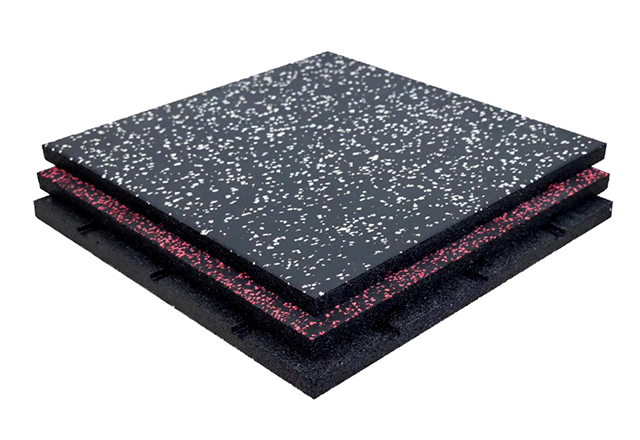
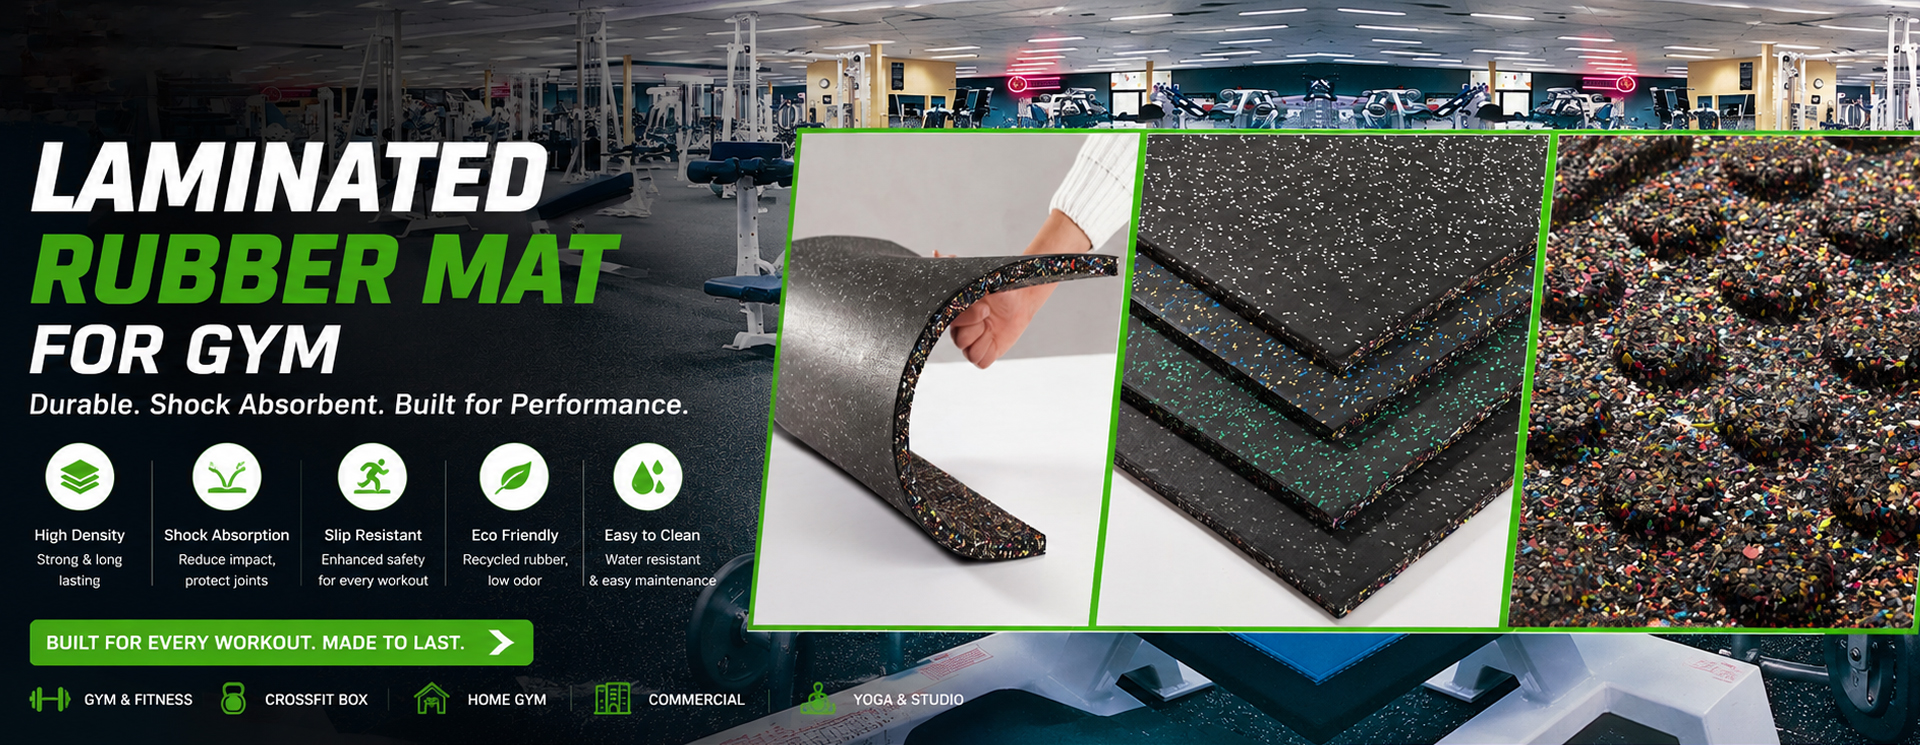
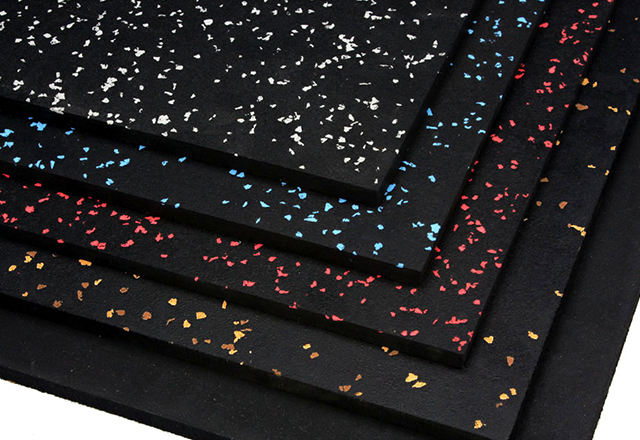
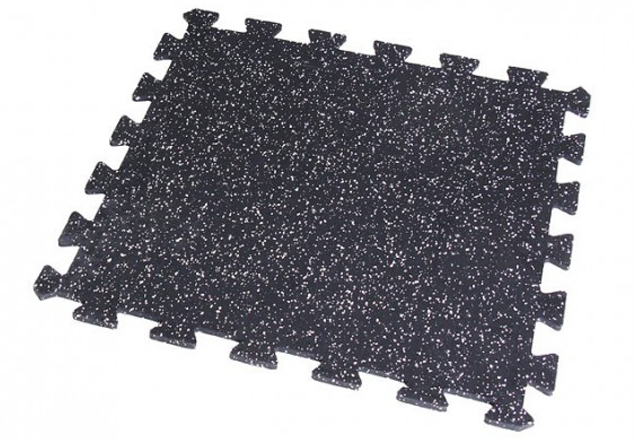
We supply 1000 × 1000 gym rubber tiles that stand up to daily heavy use in commercial spaces. As a manufacturer and wholesale supplier, we can match tough demand with reliable quality and quick lead times. Our tiles deliver excellent shock absorption, anti-slip surface, and water resistance, making them perfect for busy gyms, studios, and training centers. The 1000 × 1000 size provides seamless coverage and a clean, uniform look, while interlocking edges ensure fast, tool-free installation and simple maintenance. We offer Wholesale pricing and flexible MOQs, so you can equip multiple locations without breaking budgets. Durable, recycled rubber options help you meet sustainability goals while reducing maintenance costs. Custom colors and thicknesses are available to meet your branding or workout needs. If you’re a buyer seeking dependable, scalable flooring from trusted Manufacturers like us, I’m ready to quote and support your bulk orders today.
Hot Selling Product

1000 × 1000 gym rubber tiles Factory Trusted by Pros

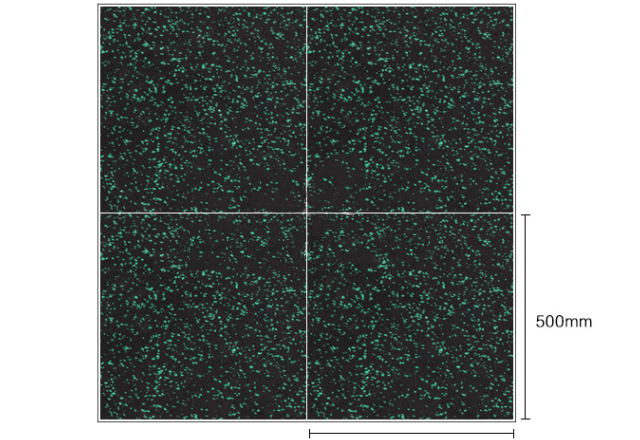
Global buyers seeking reliable gym flooring will value the 1000 × 1000 mm rubber tiles for both corporate and studio environments. The 1 m square tiles offer a seamless, professional look with an interlocking system that speeds up installation and minimizes gaps. Built to withstand heavy equipment and intense daily use, they provide a stable, safe surface that pros trust for performance areas, weight rooms, and functional training zones. Available in varying thicknesses and textures to optimize grip, shock absorption, and durability, these tiles reduce noise and protect subfloors from impact. They resist spills, are easy to clean, and demand low maintenance with a long service life and cost efficiency through modular replacement. For global procurement, the combination of consistent quality, supply reliability, and compliance with international standards makes them a pragmatic choice for gyms, studios, and wellness centers worldwide.

{ 1000 × 1000 gym rubber tiles Factory Trusted by Pros}

Model ID Tile Size (mm) Thickness (mm) Material Density (kg/m³) Compressive Strength (MPa) Shore Hardness (Shore A) Slip Resistance Color Options Surface Texture Fire Rating Standards Weight per Tile (kg) Country of Origin Warranty (years) Installation Method
T-EPDM-1000-12 1000 × 1000 12 EPDM Rubber 1200 0.95 65 R10 (DIN 51130) Black, Gray Grid embossed EN 13501-1 B-s1, d0 EN 13501-1; REACH Compliant 6.5 China 10 Interlock and Adhesive
T-EPDM-1000-15 1000 × 1000 15 EPDM Rubber 1250 1.15 66 R11 (DIN 51130) Black, Blue, Gray Grid embossed EN 13501-1 B-s1, d0 EN 13501-1; REACH Compliant 7.3 China 12 Interlock and Adhesive
T-EPDM-1000-18 1000 × 1000 18 EPDM Rubber 1300 1.38 68 R11 (DIN 51130) Black, Green, Blue Waffle EN 13501-1 B-s1, d0 EN 13501-1; REACH Compliant 8.5 Malaysia 12 Interlock and Adhesive
T-SBR-1000-12 1000 × 1000 12 SBR Rubber 1100 0.75 58 R9 Red, Black Smooth EN 13501-1 B-s1 EN 13501-1; REACH 6.1 Vietnam 10 Interlock
T-EVA-1000-12 1000 × 1000 12 EVA 990 0.50 40 R9 Yellow, Gray Pebble EN 13501-1 B-s2 REACH Compliant 5.0 China 8 Glue or Interlock
T-SBR-1000-15 1000 × 1000 15 SBR Rubber 1120 0.90 60 R10 Black, Gray Grid EN 13501-1 B-s1 EN 13501-1; REACH 6.7 Vietnam 10 Interlock and Adhesive
T-EVA-1000-18 1000 × 1000 18 EVA 980 0.65 42 R9 Gray, Blue Smooth EN 13501-1 B-s2 REACH Compliant 6.2 Vietnam 8 Adhesive
T-EPDM-1000-20 1000 × 1000 20 EPDM 1200 1.60 66 R11 Black, Blue, Red Grid EN 13501-1 B-s1, d0 EN 13501-1; REACH 9.0 Malaysia 15 Interlock

Related Products

banner 4

1000 × 1000 gym rubber tiles Where Service Meets Innovation From Concept to Delivery

Data Dimension: Stage-wise Lead Time Across Months

Jan Feb Mar Apr May Jun Sourcing Molding Delivery

The dataset analyzes the lead times across three production stages—Sourcing, Molding, and Delivery—for six consecutive months, representing the production workflow from concept to delivery of 1000 × 1000 gym rubber tiles. The stacked bar chart shows how each stage contributes to the total cycle time and how monthly variability affects overall performance. In January, total lead time is about 22 days with Sourcing at 6 days, Molding at 12 days, and Delivery at 4 days. February improves slightly to 21 days as Sourcing and Delivery shorten while Molding remains the primary driver. March peaks at 26 days due to longer Molding and Sourcing, indicating capacity pressures during ramp-up. April returns to around 22 days with a distribution similar to January. May records 21 days, with modest shifts among stages. June ends at 22 days, echoing early-year performance. From the chart, Molding consistently consumes the largest share of lead time, making it the primary target for efficiency improvements. Sourcing follows as the second-largest contributor, reflecting supplier lead times and material availability. Delivery, while smaller, adds variability tied to logistics capacity and scheduling. To reduce cycle times, actions could include increasing mold throughput through automation, optimizing curing cycles, stabilizing supply chains via multi-sourcing, and implementing a pull-based production plan aligned with demand forecasts. Reducing changeover times and enabling parallel processing could yield meaningful gains. This visualization demonstrates how stage-level performance aggregates into an overall timeline across six months, guiding decisions about capacity, automation, and supplier relationships to accelerate From Concept to Delivery while maintaining quality and cost efficiency.

Top Selling Products