
commercial PVC flooring - China Manufacturer
From factory to site, I offer durable commercial PVC flooring that stands up to high foot traffic and heavy equipment. I am a China-based manufacturer with a wide range of planks, tiles, and seamless sheets in anti-slip, easy-clean finishes. Our flooring resists denting and moisture, meets fire and IAQ standards, and installs quickly with minimal downtime. You need consistency in color, pattern, and thickness on large projects, so we provide certified batches, strict QA, and reliable lead times. With fast quotes and flexible packaging, I help procurement teams stay on budget. We tailor thickness, wear layer, and surface texture to fit your design goals. If you seek a long-term supplier for hotels, retail centers, offices, or healthcare corridors, I am here to support you. Let’s discuss your project and samples today.
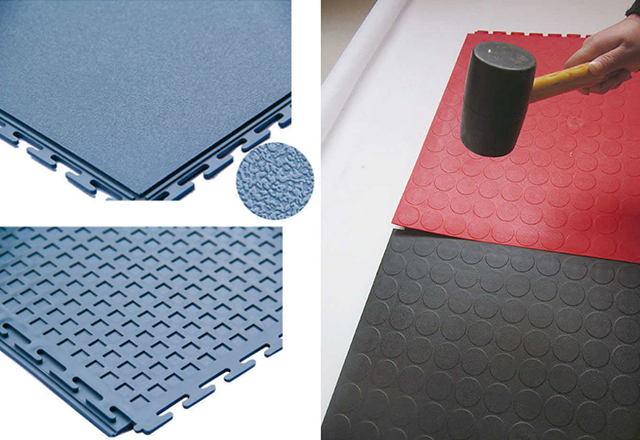
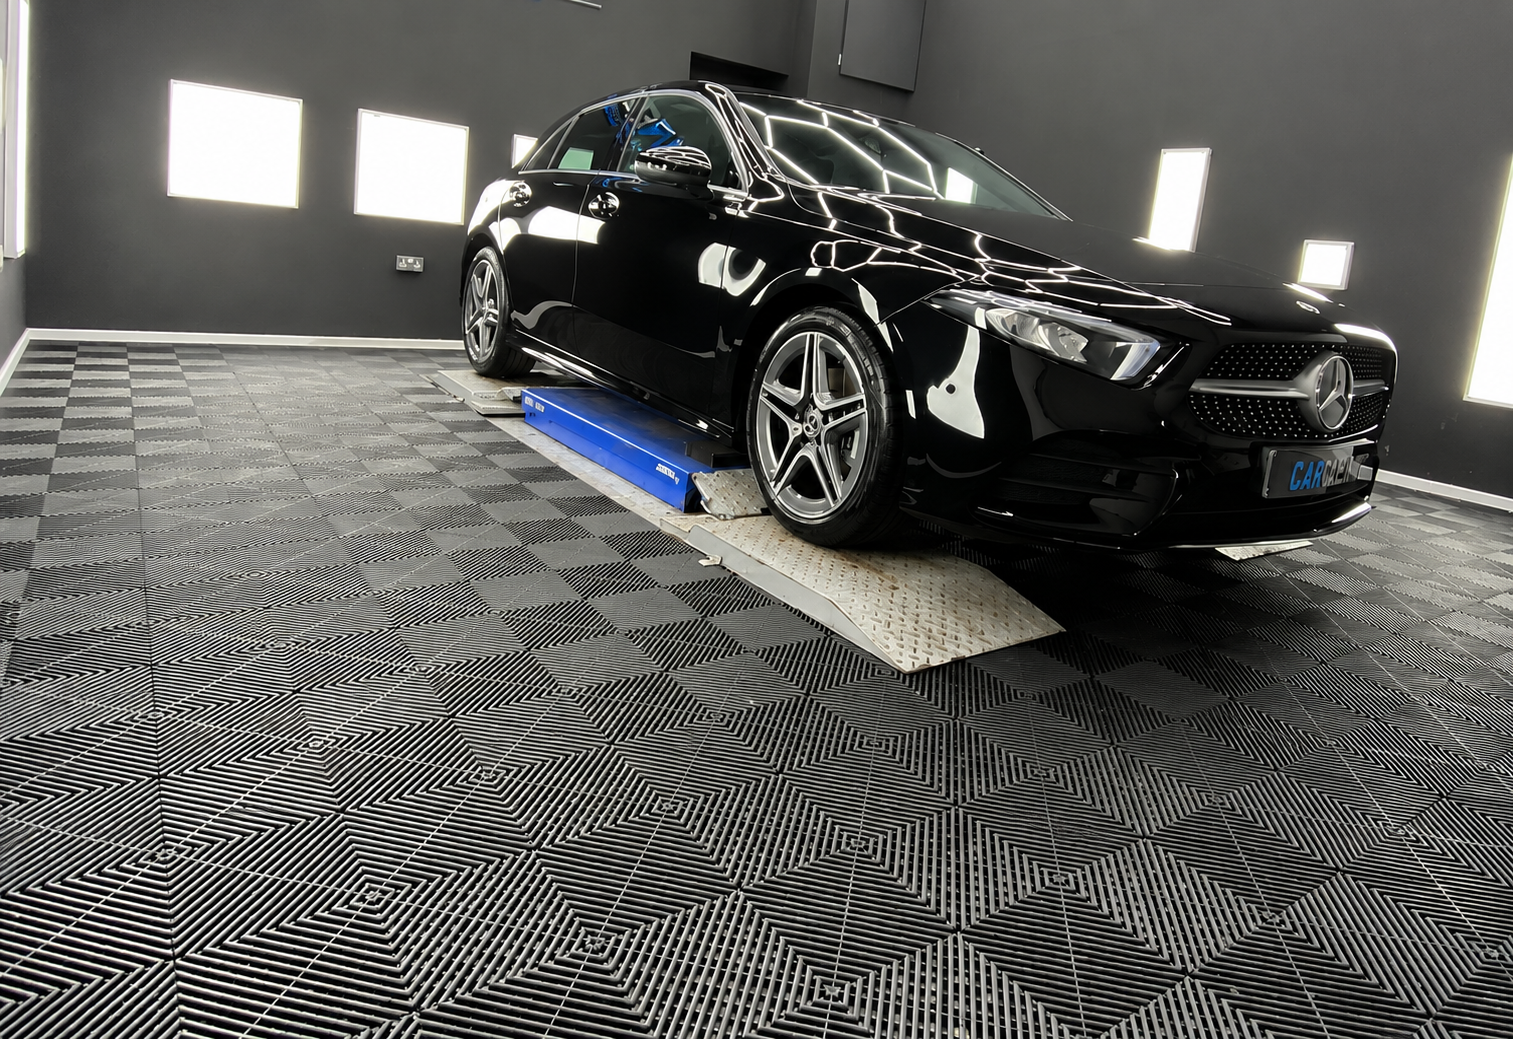
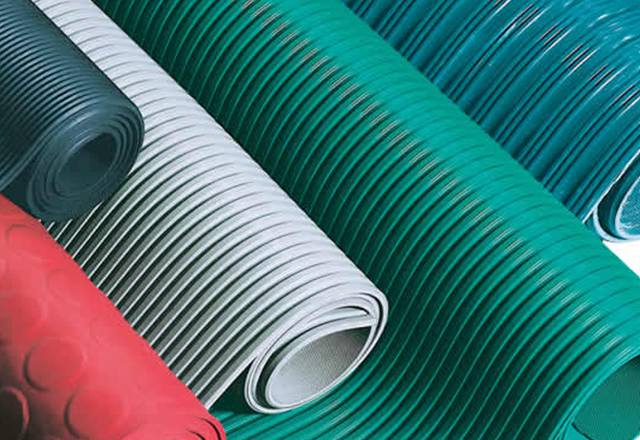
commercial PVC flooring in 2025 Sets the Industry Standard
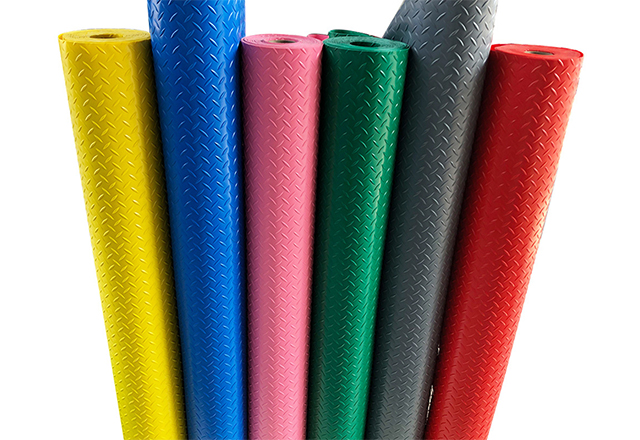
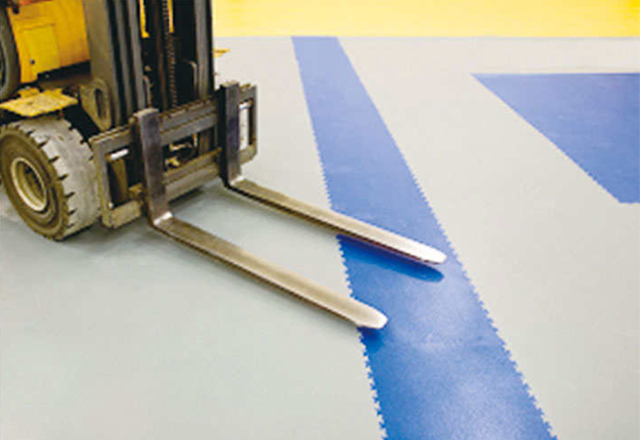
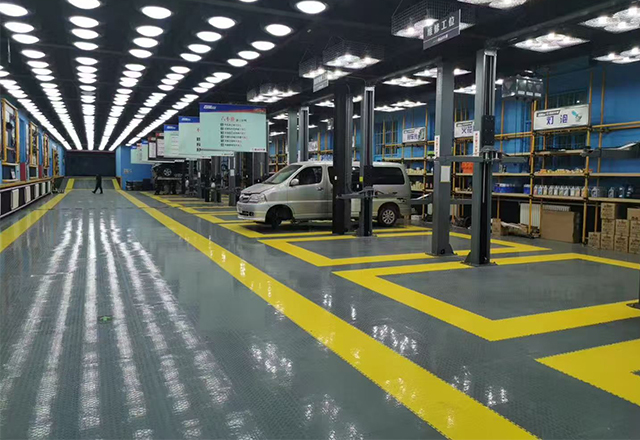
In 2025 commercial PVC flooring has redefined expectations—combining engineered wear layers, advanced embossed textures and acoustic cores to deliver unmatched durability, slip resistance and low maintenance for high-traffic environments. New formulations prioritize low VOC emissions and recycled content without sacrificing appearance or performance, while high-definition printing and customizable plank sizes let global projects match aesthetic, safety and sustainability targets with predictable lifecycle costs and extended warranties. As a global supplier with modern production and strict quality controls, we support large-scale procurement with reliable lead times, flexible customization, international certifications and end-to-end logistics. Buyers benefit from on-site testing, sample programs and responsive after-sales support to ensure seamless specification, installation and long-term value for hospitals, retail, education and commercial fit-outs worldwide.
| Characteristic | Standard / Test | Typical Commercial PVC (2025) | Notes |
|---|---|---|---|
| Product variants | Market categories | Heterogeneous sheet, LVT (tiles/planks), Homogeneous sheet | All variants widely used in commercial buildings; selection depends on traffic and installation. |
| Wear layer thickness | Industry measurement (mm) | Typical range: 0.30–0.80 mm; common commercial: 0.55 mm | Thicker wear layers used for heavy traffic and longer service life. |
| Total thickness | Typical metric (mm) | 2.0–5.0 mm (most commercial products 2.5–4.0 mm) | Includes wear layer, printed design layer, backing/underlay. |
| Commercial use classification | ISO 10874 / EN 685 | Up to Class 33 (heavy commercial) commonly achieved | Class indicates suitability for different traffic levels in Europe and per ISO. |
| Slip resistance | DIN 51130 / ramp test | Typical R10; ranges R9–R11 depending on surface finish | Higher R-values often specified for kitchens, ramps and industrial zones. |
| Fire performance | EN 13501-1 | Common classification: Bfl‑s1 (limited flame spread, low smoke) | Many commercial vinyl products meet Bfl‑s1 with appropriate backing. |
| VOC emissions (TVOC) | Indoor air quality tests (28 days) | Typical certified value: <100 µg/m³ (28 days) for low‑emitting products | Many commercial products tested to meet common IAQ programs; values vary by formulation. |
| Cradle‑to‑gate GWP | EPD / LCA reporting | Typical range: 4–9 kg CO2e per m²; median ~6 kg CO2e/m² | Values depend on formulation, recycled content and manufacturing energy mix. |
| Recycled content | % by weight | Typical commercial products: 0–30% (many ~10% post‑industrial PVC) | Post‑industrial recycled content more common than post‑consumer today. |
| Recyclability | End‑of‑life options | Mechanically recyclable; chemical recycling technologies emerging | Local recycling availability varies by region; installation waste often reclaimed. |
| Expected commercial service life | Typical operating years | 10–25 years depending on wear layer and maintenance; common range 12–20 years | Higher traffic and poor maintenance shorten life; heavier wear layers extend it. |
| Impact sound reduction | ISO 717‑2 / field measurements | Without underlay: ~3–6 dB; with acoustic underlay: ~12–18 dB (typical 15 dB) | Acoustic performance strongly influenced by backing/underlay choice. |
| Thermal conductivity | W/m·K | Typical: 0.12–0.25 W/m·K (approx. 0.18 W/m·K) | Suitable for use over underfloor heating when compatible adhesives and installation practiced. |
| Dimensional stability | Measured at elevated temp (%) | Typical ≤0.20%; many products ≤0.10% under controlled test | Good stability reduces gapping and buckling in varied environments. |
| Residual indentation | EN ISO 24343‑1 (mm) | Typical commercial: ≤0.10 mm; high‑performance ≤0.08 mm | Lower residual indentation preferred for furniture and heavy loads. |
| Maintenance | Cleaning frequency | Daily routine cleaning; periodic deep clean every 6–12 months | Maintenance protocol impacts longevity and appearance retention. |
| Water resistance | Performance | Fully water‑resistant materials; welded joints required for continuous wet areas | Suitable for washrooms and healthcare when installed and detailed correctly. |
| Antimicrobial options | ISO test references | Optional surface treatments often tested to ISO 22196/21702; >99% reduction under test conditions | Antimicrobial finish is an added feature; efficacy depends on test and real‑world conditions. |
Related Products
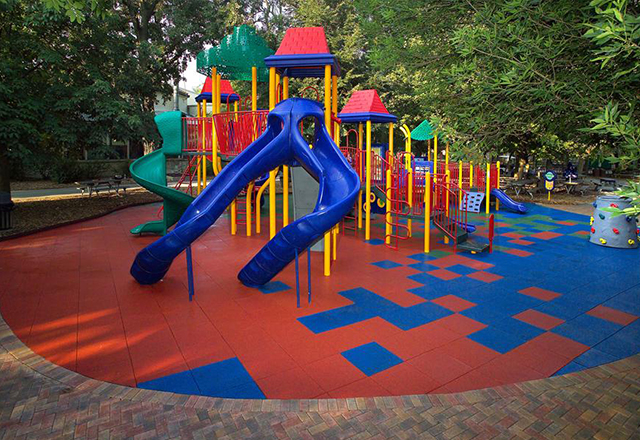
commercial PVC flooring Guarantees Peak Performance Where Service Meets Innovation
Top Selling Products
- Related Blog
- Reviews
