
Horse Stable Rubber Pavers - China Manufacturer for Durable Flooring
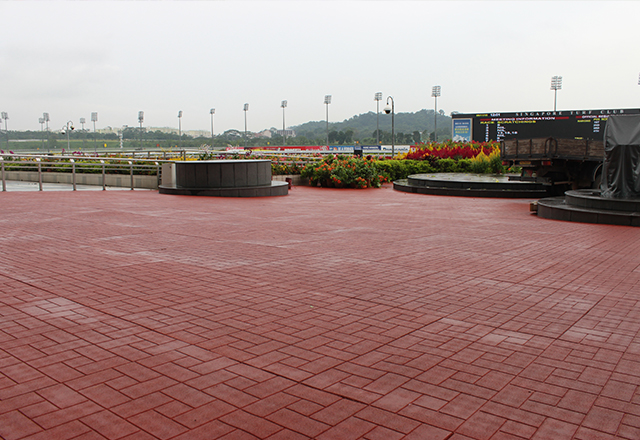
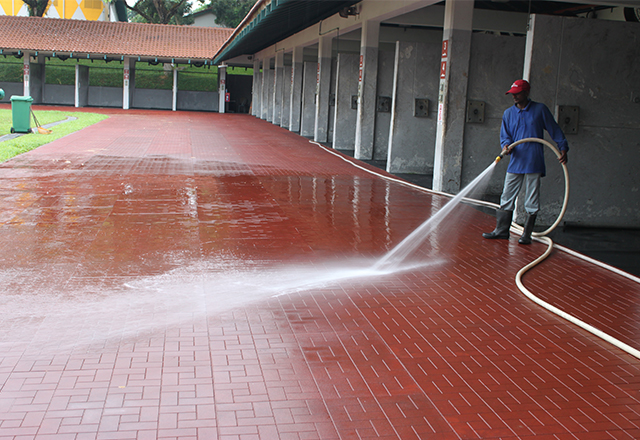
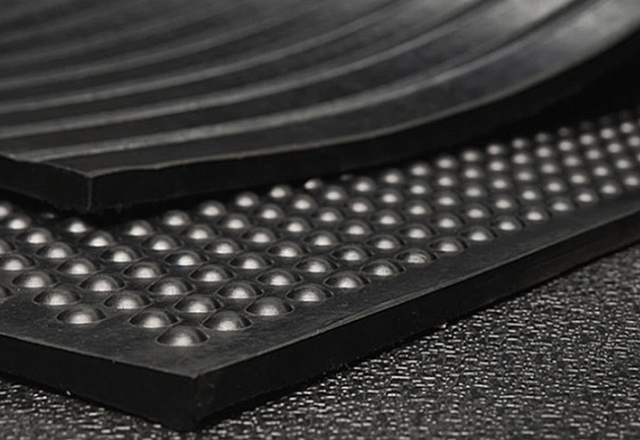
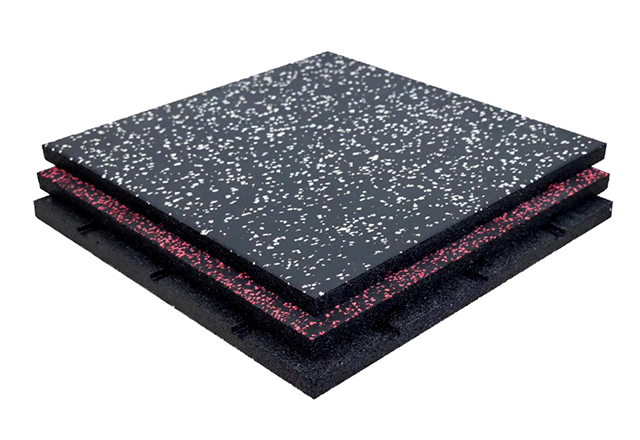
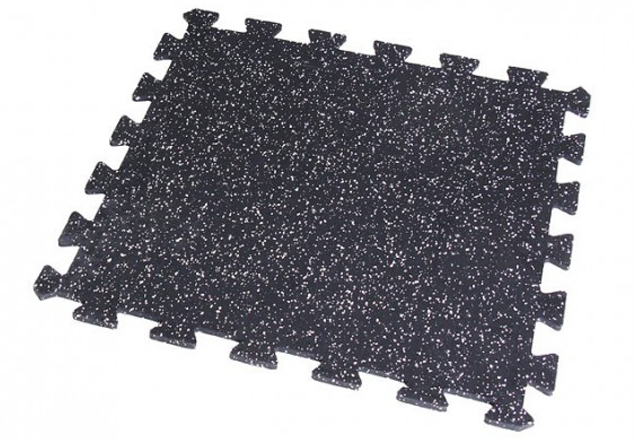
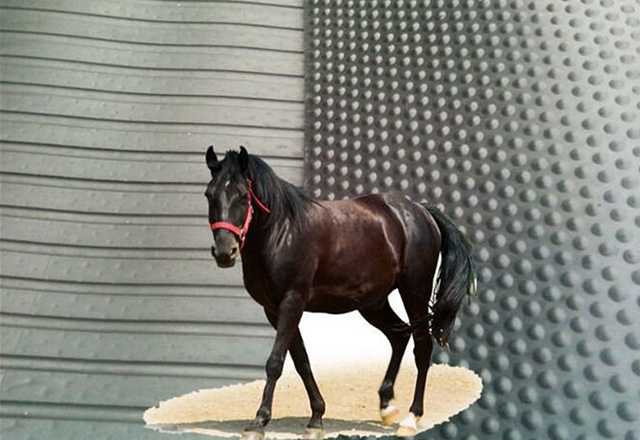
From my workshop to your project, I offer horse stable rubber pavers built to handle busy yards and demanding horses. As a China Manufacturer, we deliver reliable, cost-effective solutions with short lead times and scalable orders. Our horse stable rubber pavers lock together for a seamless, drainage-friendly surface that resists cracking under freezing temps and heavy hooves. The non-slip tread keeps footing secure in wet conditions, while the open-grid design promotes drainage and reduces mud. I can tailor thicknesses and colors to match your stable layout, and we offer OEM packaging and labeling for seamless installation at the job site. For distributors and project buyers, our MOQ is flexible and pricing is competitive for large orders. I stand behind durability, easy maintenance, and long service life. If you’re sourcing in China or internationally, I’ll personally ensure fast transit, minimal waste, and clear documentation for a smooth purchase of horse stable rubber pavers.
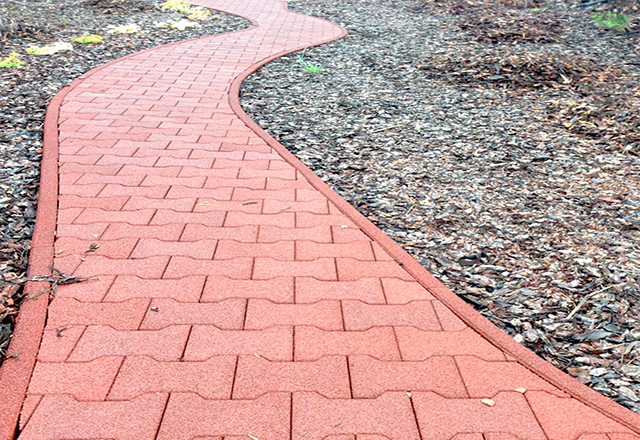
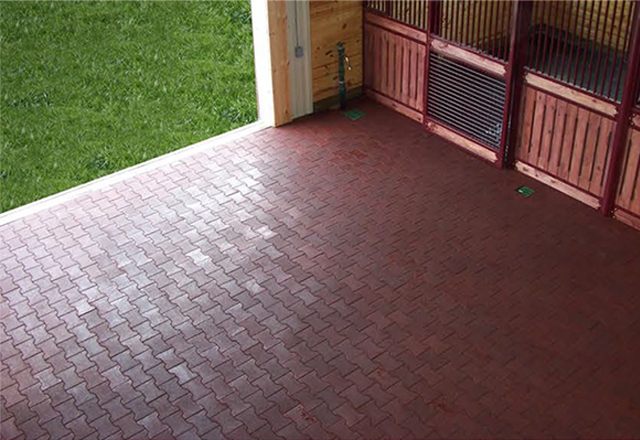
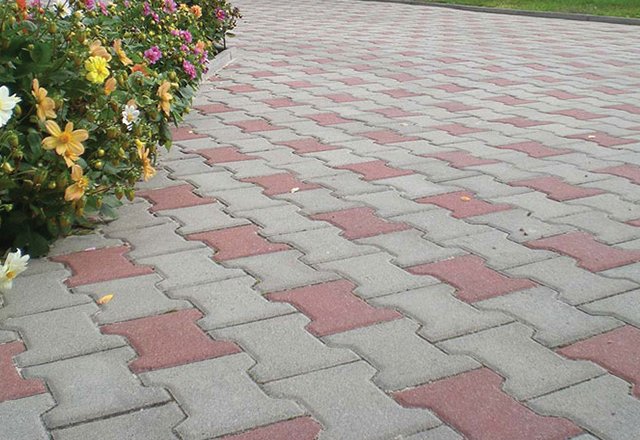
horse stable rubber pavers Dominates Custom Solutions,
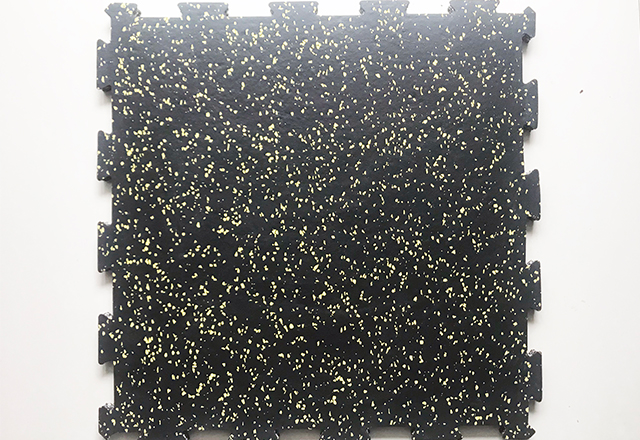
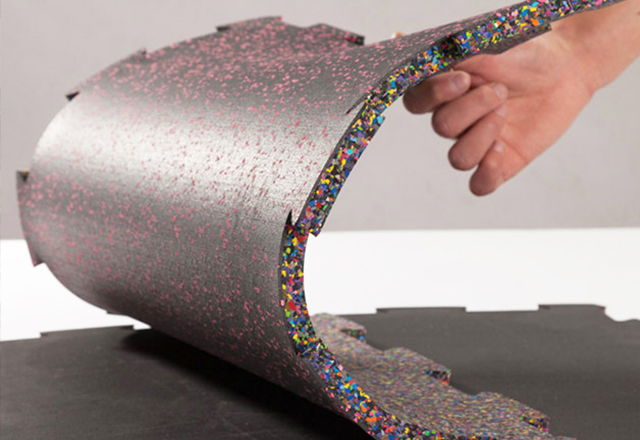
Global horse facilities are turning to rubber pavers for stable floors as a trusted, dominant solution for customized footing. Interlocking modules provide slip resistance and a cushioned surface to protect joints, while built-in drainage keeps stalls dry. Durable and easy to maintain, they withstand daily wear, ammonia, and cleaners. With varying thicknesses, textures, and edge trims, they fit irregular layouts, ramps, and stalls. Many options are made from recycled rubber, offering a sustainable path to long-lasting stability. From a procurement view, modular design simplifies shipping, installation, and multi-site deployment. Standard modules, reliable quality, and scalable production support predictable lead times and budgets. Proper subfloor prep and drainage planning maximize lifespan across climates. Custom configurations—thickness, color, texture, and packaging—enable regional needs for show rings, clinics, or breeding barns. For buyers seeking tailored solutions, co-engineering can align with exact stall dimensions and cleaning routines, delivering a reliable global flooring platform.
| Product_ID | Surface_Type | Profile | Length_mm | Width_mm | Thickness_mm | Density_kg_per_m3 | Shore_A | Compressive_Strength_MPa | Friction_CoF | Temperature_Range_C | UV_Resistant | Installation_Type | Maintenance_Months | Expected_Life_Years | Certification |
|---|---|---|---|---|---|---|---|---|---|---|---|---|---|---|---|
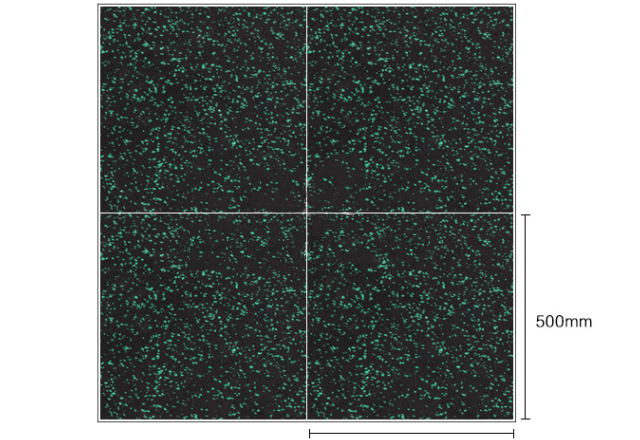
| HSP-R01 | Rubber Paver | Interlocking | 500 | 500 | 20 | 1120 | 65 | 3.5 | 0.65 | -20 to 60 | Yes | Interlocking | 12 | 12 | ISO 9001 |
| HSP-R02 | SBR Rubber Tile | Flat | 600 | 600 | 12 | 1100 | 60 | 2.8 | 0.62 | -15 to 55 | Yes | Glue-down | 6 | 10 | ISO 9001 |
| HSP-R03 | Natural Rubber Composite | Interlocking | 400 | 400 | 25 | 1080 | 70 | 3.2 | 0.70 | -25 to 50 | Yes | Interlocking | 12 | 15 | ISO 9001 |
| HSP-R04 | EPDM Top Layer Paver | Interlocking | 300 | 300 | 18 | 1120 | 68 | 3.0 | 0.66 | -20 to 60 | Yes | Floating | 12 | 13 | ISO 9001 |
| HSP-R05 | Recycled Crumb Rubber Tile | Interlocking | 500 | 500 | 15 | 1060 | 58 | 2.6 | 0.58 | -10 to 50 | Yes | Interlocking | 6 | 9 | ISO 9001 |
| HSP-R06 | PU Underlay Layer | Flat | 600 | 600 | 10 | 1050 | 55 | 2.4 | 0.60 | -30 to 70 | Yes | Glue-down | 12 | 8 | ISO 9001 |
Related Products
horse stable rubber pavers Dominates Now Trending
Top Selling Products
- Related Blog
- Reviews
