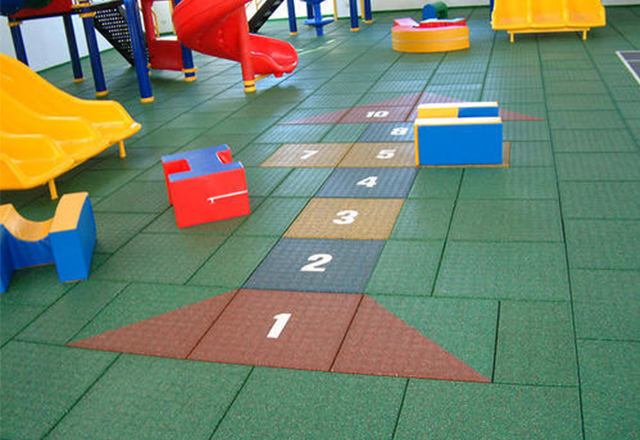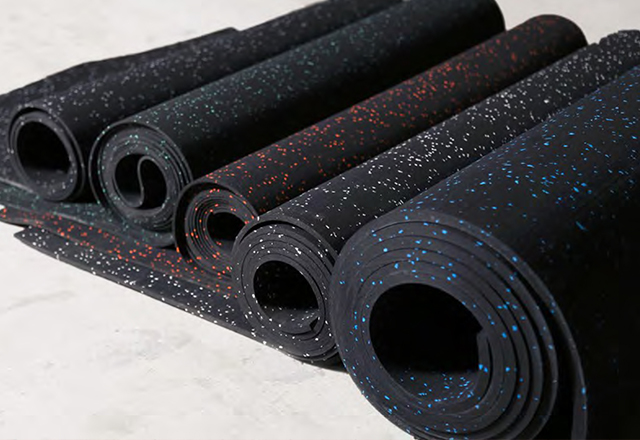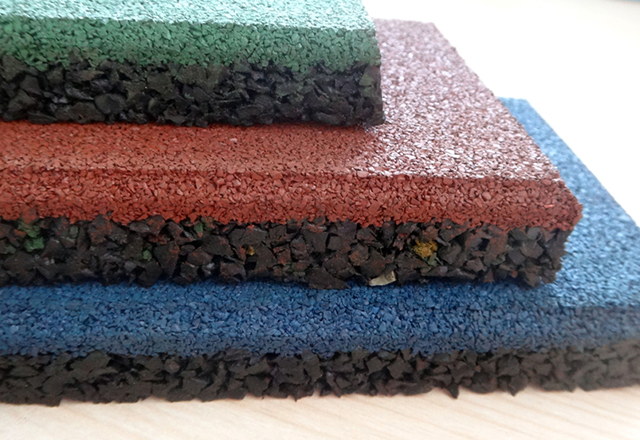
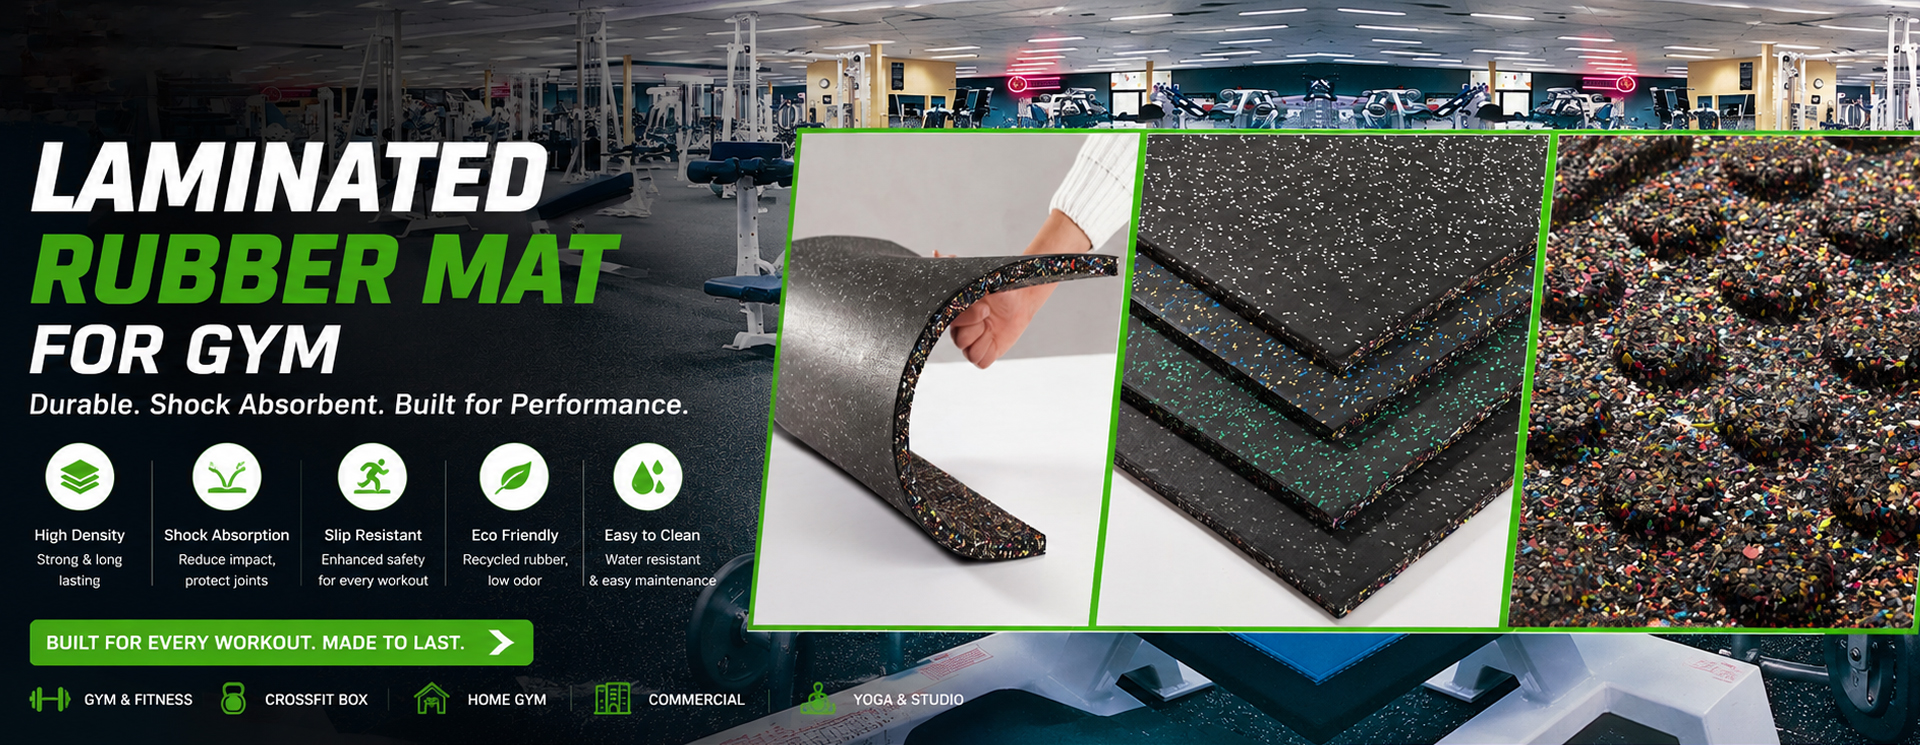
banner 1

Interlocking PP Floor Tiles - High-Quality Supplier

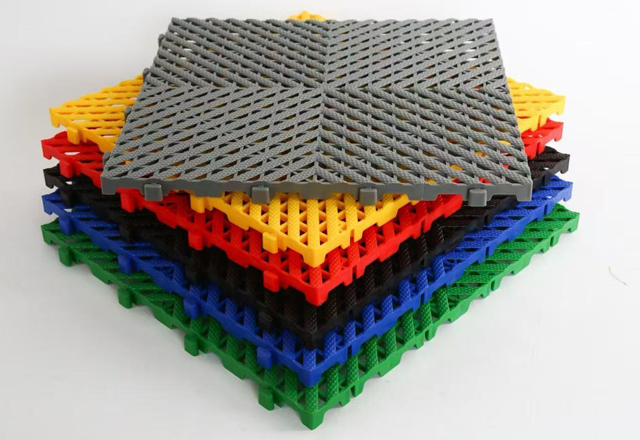
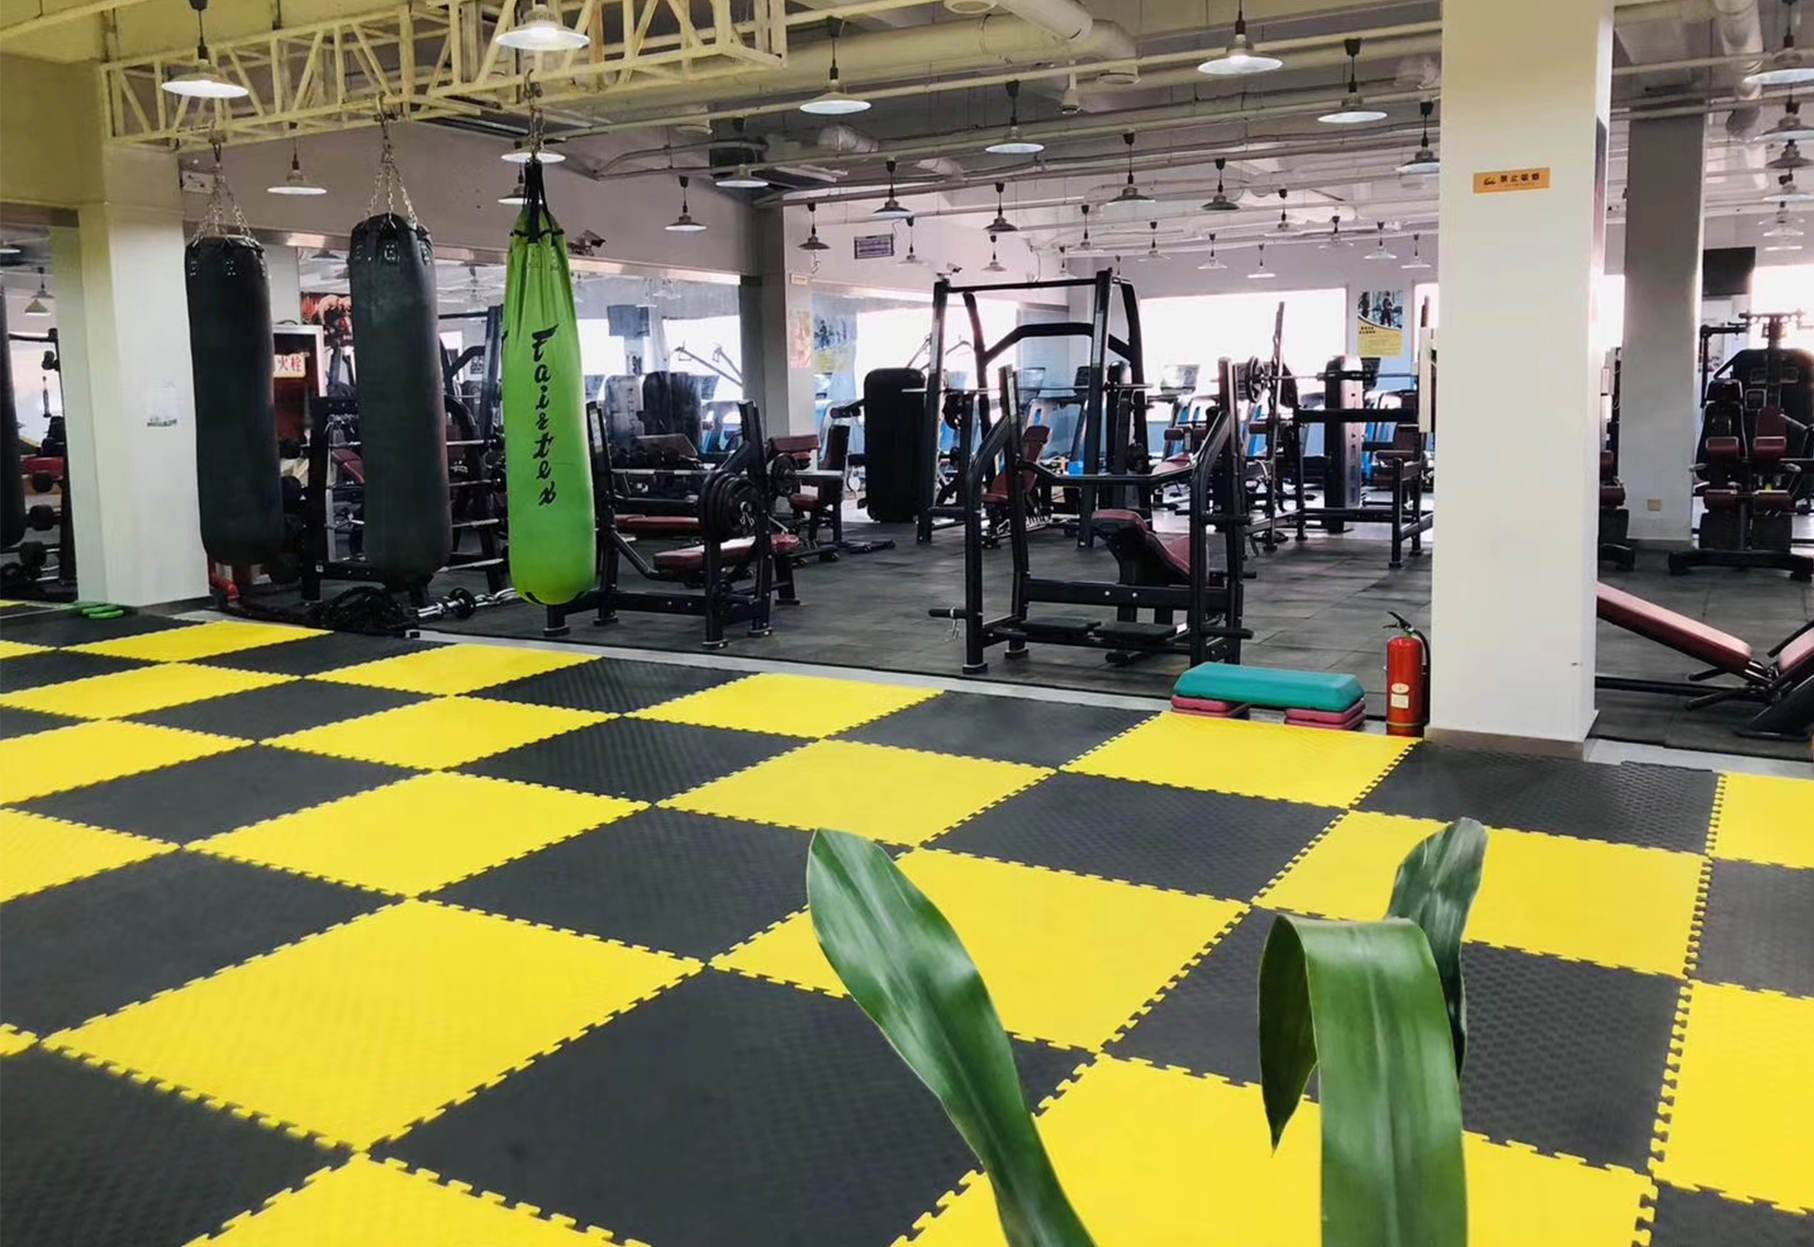
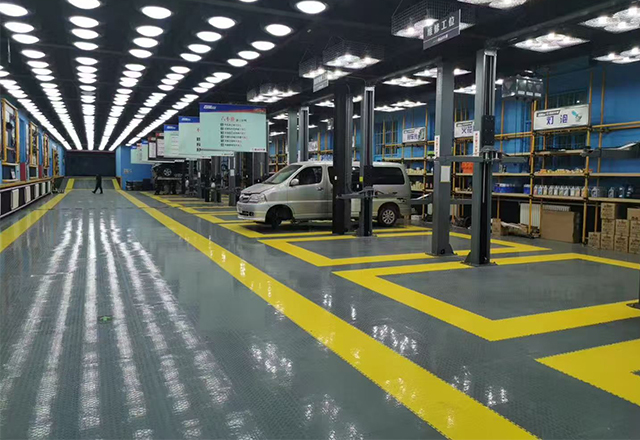
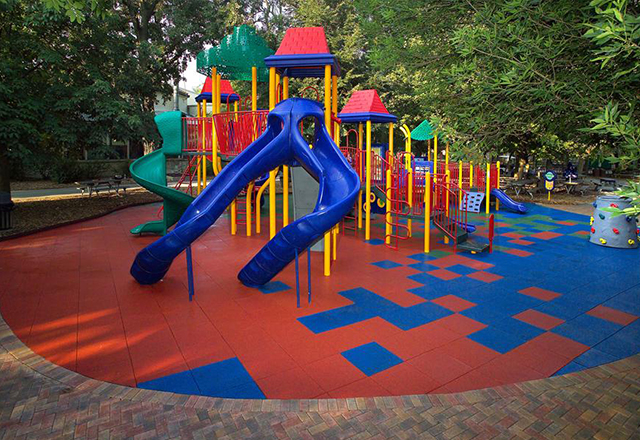
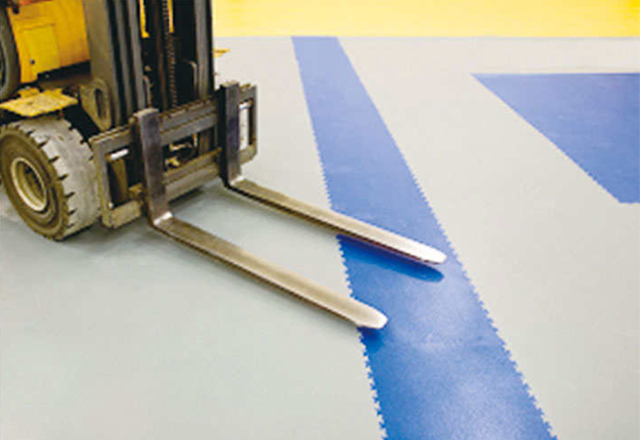
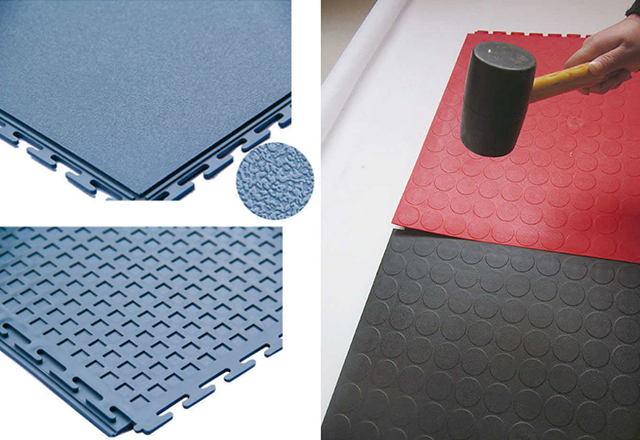
I supply interlocking PP floor tiles that stand up to heavy foot traffic, spills, and temperature swings. As a trusted Supplier, I insist on High-Quality materials, strict tolerances, and bold color stability. They install in minutes, lock without glue, and can be reconfigured as needs change. Thanks to a durable polypropylene core and textured surface, they resist impact, water, chemicals, and UV fade while staying slip-resistant. The modular design makes maintenance simple and repairs quick, and the tiles are recyclable at end of life. Available in multiple thicknesses and colors to suit workshops, gyms, retail floors, or training centers, they offer a cost-effective, long-life flooring solution with minimal downtime. If you’re after a reliable, scalable option for your site, I can tailor a layout and supply plan that fits your budget and schedule.
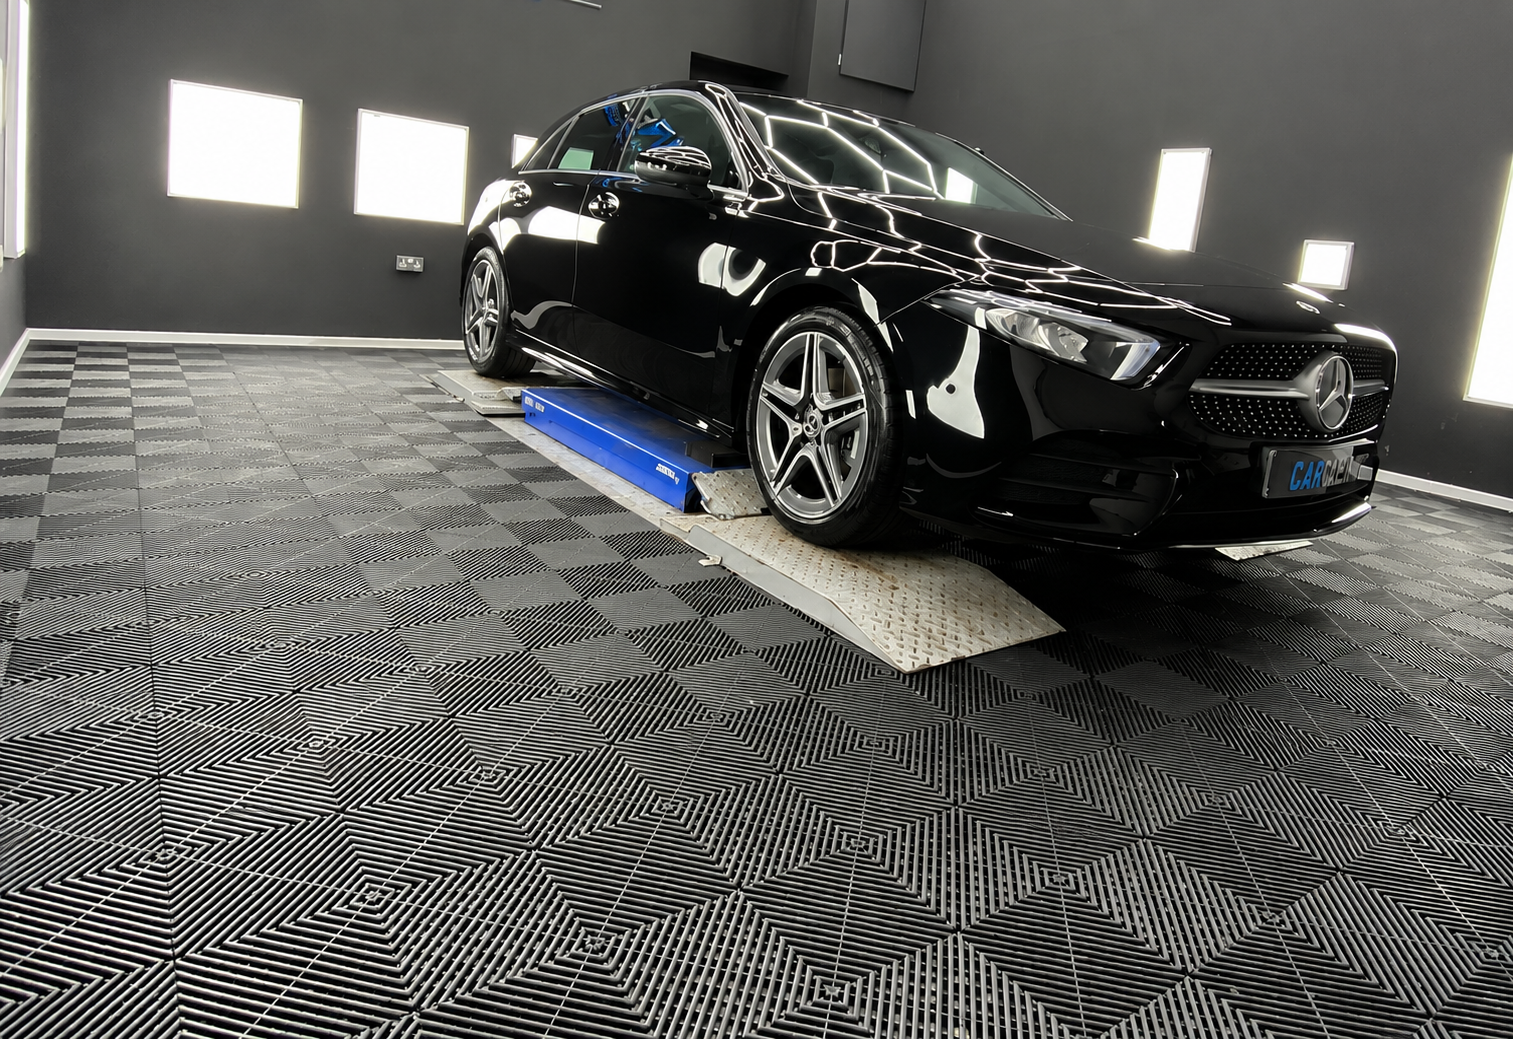
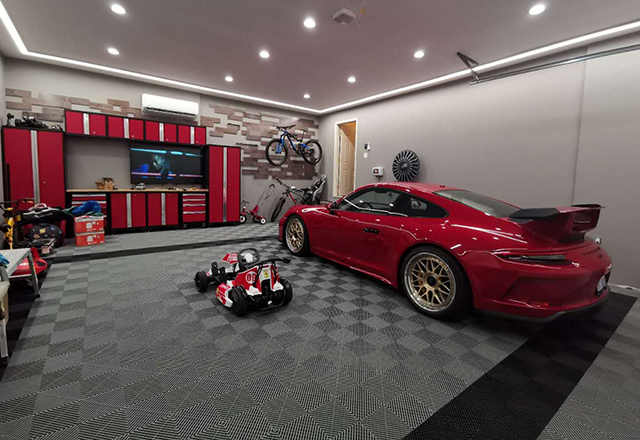
Hot Selling Product

interlocking PP floor tiles Exceeds Industry Benchmarks Custom Solutions,

Global buyers seek durable, hygienic, cost-efficient flooring. Interlocking PP tiles offer fast, tool-free installation and seamless, flat surfaces. They typically exceed benchmarks in durability, chemical resistance, UV stability, and impact strength, delivering long service life in warehouses, labs, kitchens, and retail spaces. Customization is a key advantage: thickness, edge profiles, sizes, colors, and textures can be tailored to load ratings, slip resistance, drainage, or branding. Options include anti-slip textures, antimicrobial finishes, drain-through designs, and compatible edging, delivering a turnkey flooring system for varied workflows. From design support to scalable manufacturing and reliable global logistics, this solution offers consistent quality, certification readiness, and strong total-cost-of-ownership benefits. For procurement teams seeking a future-proof floor system, flexible PP tiles enable optimized performance across markets. Request samples to explore your custom configuration today.

{ interlocking PP floor tiles Exceeds Industry Benchmarks Custom Solutions,}

Dimension Metric Value Unit Industry Benchmark Test Method Year
Material properties Tensile strength 38 MPa 28 ISO 527 2023
Material properties Flexural strength 45 MPa 40 ISO 178 2023
Impact resistance Notched impact 6.8 kJ/m2 5.0 ASTM D256 2022
Wear resistance Abrasion loss (CS wheel) 12 mg/1000 cycles 15 ASTM D4060 2021
UV stability Color change (ΔE) 2.1 ΔE 4.0 ISO 4892-2 2023
Water performance Water absorption 0.18 % 0.40 ISO 62 2022
Slip resistance Dynamic coefficient of friction 0.65 COF 0.55 EN 13893 2023
Recyclability Recyclability 92 % 85 Life cycle assessment 2022
Fire performance Flammability rating V-0 Rating V-0 UL 94 2020

Related Products

banner 4

interlocking PP floor tiles Custom Solutions, Outperforms the Competition

Data Dimension: Time-to-Solution Efficiency Index

Interlocking PP Floor Tiles – Custom Solutions Performance Over Time

100 80 60 40 20

This chart presents a simulated representation of the Time-to-Solution Efficiency Index for a hypothetical line of interlocking polypropylene floor tiles with customized solutions. The data illustrate monthly performance over a year, with the index ranging from 0 to 100, where higher values indicate faster delivery, higher first-pass yield, and lower cycle times. The upward trajectory reflects improvements in tooling, process standardization, and supplier integration that typically accompany a transition from bespoke to standardized customized configurations.

Although the values are synthetic, they model a common pattern observed when customization is implemented in a controlled manner: early-stage inefficiencies due to new tooling or designs gradually yield to greater stability and throughput as experience grows. The rising trend suggests that the company is capturing gains from better design reuse, modular tooling, and streamlined changeover practices. The metric also helps identify periods where operations may require additional attention, such as supplier onboarding, quality control, or maintenance scheduling.

For decision-makers, this time-series visualization aids comparisons across product lines or production shifts, enabling quick assessment of whether customization strategies translate into measurable improvements in delivery speed and reliability. It supports prioritization of investments in automation, modular tooling, or supplier consolidation to push the index higher and maintain momentum. While the particular dataset here is illustrative, the approach demonstrates how tracking a Time-to-Solution Efficiency Index over time can provide actionable insights, facilitate resource planning, and communicate progress to stakeholders in a clear, data-driven manner.

Beyond the chart, the Time-to-Solution Efficiency Index can be decomposed into components such as cycle time, set-up time, changeover readiness, and defect rate. Each month, teams can track sub-metrics and drill down to root causes. The index is normalized to a 0-100 scale to enable cross-comparison across lines or products with different nominal performance. In practice, a company might set targets such as reduce cycle time by 20% within 6 months, improve first-pass yield, or shorten supplier onboarding. The visualization helps stakeholders track progress toward these targets. The approach supports scenario planning: what-if analyses on the impact of automation or design reuse. The chart can be updated with real data from MES or ERP systems to provide near real-time visibility and baseline comparisons with prior quarters. Explaining the trend to non-technical audiences is facilitated by the index’s intuitive scale and consistent axis labeling, reducing cognitive load when presenting to executives or customers. When comparing competition, it's crucial to consider the scope of customization, material costs, and downstream logistics, as these influence the net benefit of optimization. The methodology presented here emphasizes consistent data collection, transparent methodology, and clear communication of assumptions. By adopting a standardized metric and a time-series visualization, organizations can align teams around common objectives: faster delivery, higher quality, and scalable customization that outperforms generic offerings. This example demonstrates how even synthetic data can communicate meaningful strategic insights and guide evidence-based decision-making in manufacturing and product design.

Top Selling Products