
Interlocking PP Tiles Manufacturer in China | High-Quality Suppliers
As a China-based manufacturer, I bring you interlocking PP tiles that install fast, last long, and stay clean. These tiles are perfect for factories, warehouses, gyms, and outdoor decks. The interlocking design snaps together without special tools, reducing labor and waste on site. They resist impact and weather, offer slip resistance, and are easy to maintain. I offer a range of thicknesses, textures, and colors, plus edge trims and logos for branding. My team ensures consistent quality with strict QC checks, scalable MOQs, and reliable lead times. Whether you're doing a pilot project or a full-scale rollout, I can match your specs, quantities, and deadlines. Choose me as your China Manufacturer for interlocking PP tiles and get competitive prices, fast delivery, and committed after-sales support to keep your project on track.
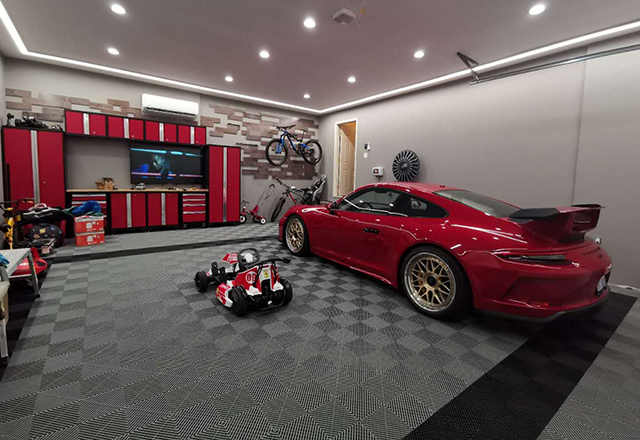
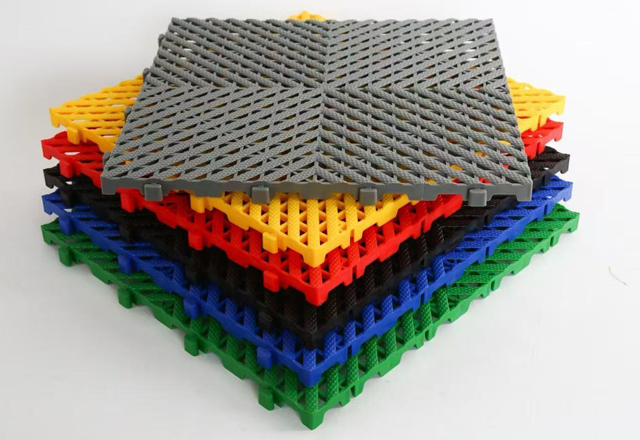
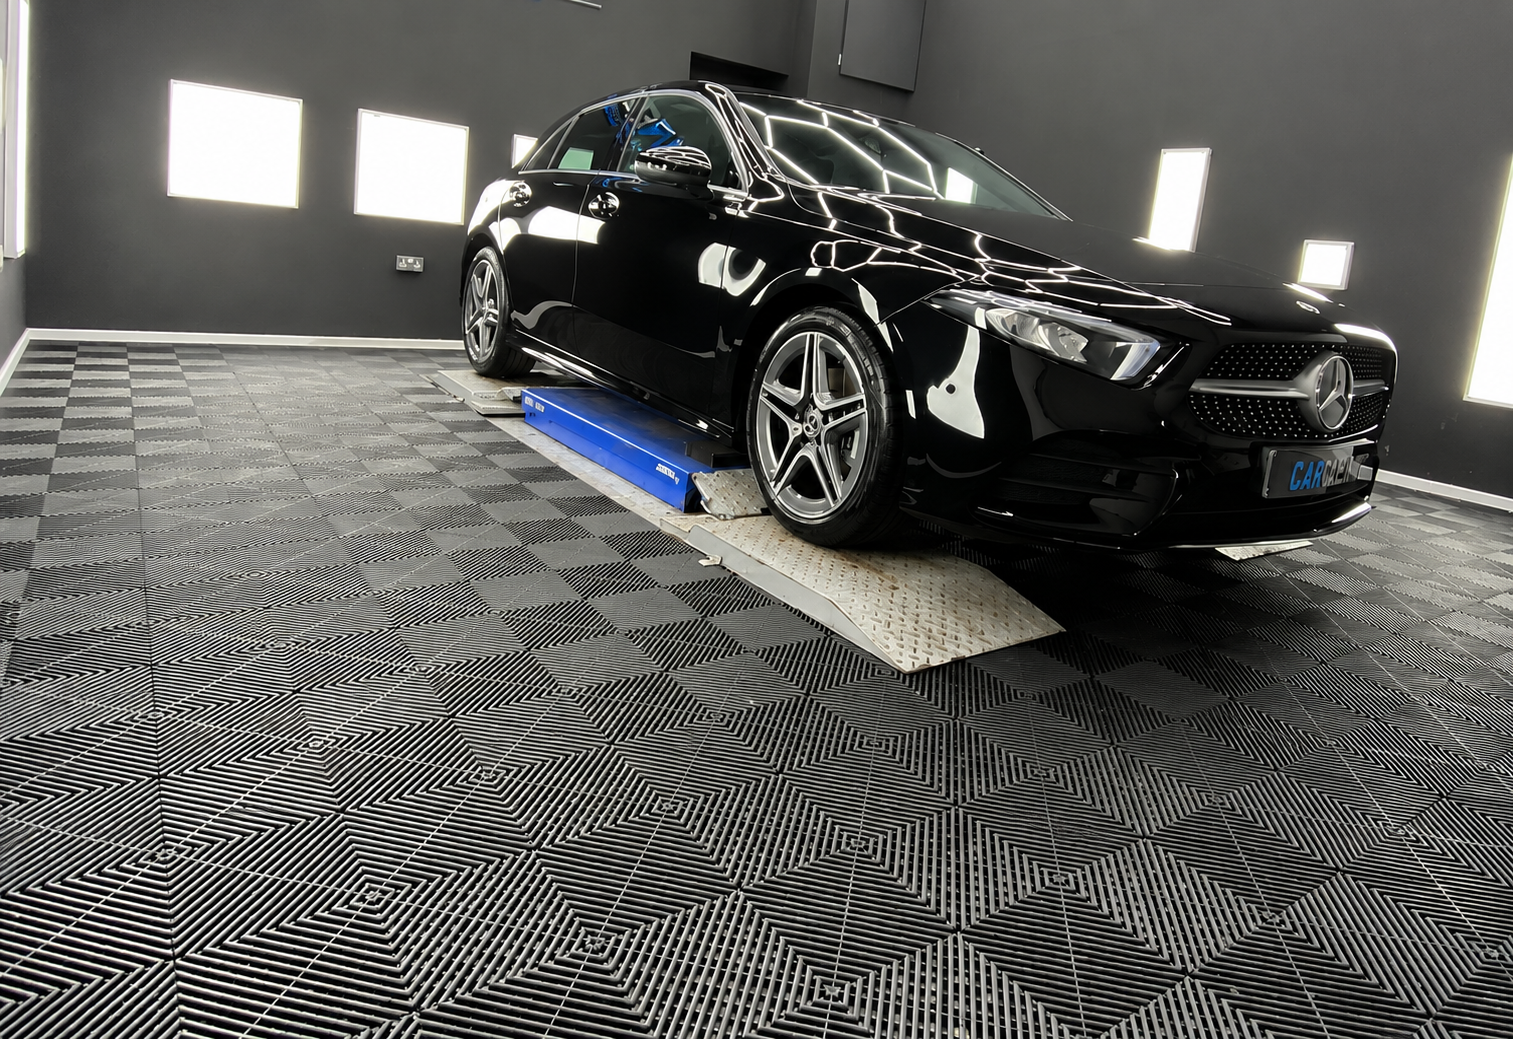
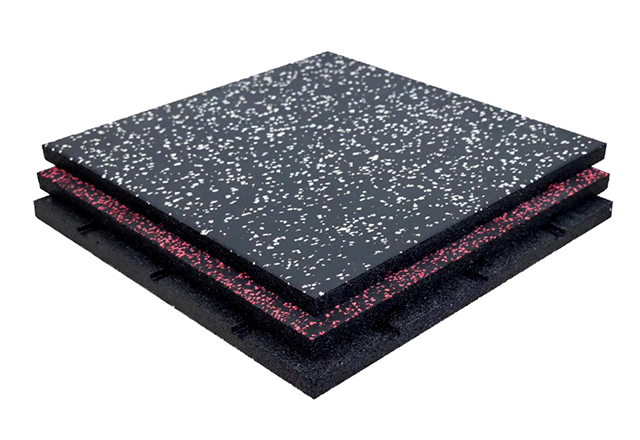
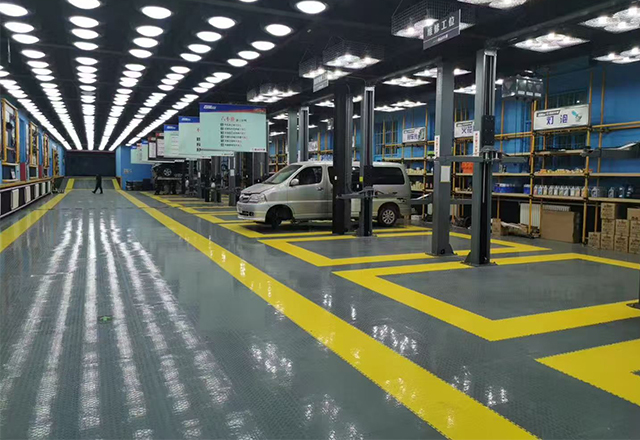
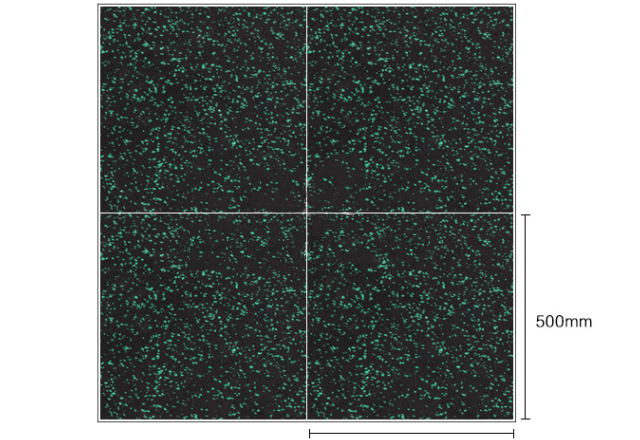
interlocking PP tiles Where Service Meets Innovation Service Backed by Expertise
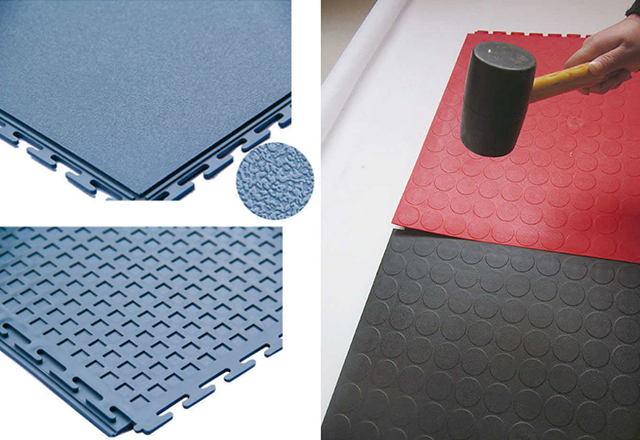
Interlocking polypropylene tiles deliver durable, weather-ready flooring that installs in hours rather than days. Lightweight yet rugged, they resist UV fading, moisture, chemicals, and heavy foot traffic, while the modular design lets buyers tailor layouts for outdoor spaces, gyms, playgrounds, and pool areas. Slip-resistant textures and color options keep maintenance simple and parts easy to replace. From needs assessment and design customization to samples, on-site guidance, and after-sales support, our approach emphasizes quality, traceability, and reliability. Global logistics, batch control, and flexible lead times ensure on-time delivery for projects of any scale, with transparent warranties and spare-part programs. By integrating polymer science with customer feedback, we deliver UV-stable, recyclable tiles with enhanced anti-slip performance. This modular system supports renovation and expansion with minimal waste, lowering total ownership costs. Buyers benefit from scalable production, international certifications, multilingual documentation, and pilots to validate fit, color, and texture before rollout.
{ interlocking PP tiles Where Service Meets Innovation Service Backed by Expertise}
| Tile ID | Interlock Pattern | Size (mm) | Thickness (mm) | Material | UV Resistance | Impact Resistance | Temp Range (°C) | Slip Resistance | Water Absorption (%) | Install Time (min/m²) | Warranty (years) | Applications | Certifications |
|---|---|---|---|---|---|---|---|---|---|---|---|---|---|
| PP-INT-001 | Dovetail | 500 x 500 | 12 | Polypropylene with UV stabilizer | ≥ 5,000 hours | High | -20 to 80 | R11 | 0.25% | 15 | 10 | Outdoor decks, stadiums | ISO 9001, ISO 14001 |
| PP-INT-002 | Chevron | 600 x 400 | 12 | PP with stabilizers | ≥ 4,000 hours | Medium-High | -20 to 70 | R11 | 0.30% | 12 | 8 | Warehouses, mezzanines | CE, RoHS |
| PP-INT-003 | Grid | 500 x 500 | 16 | High-density PP | ≥ 6,500 hours | Very High | -30 to 85 | R12 | 0.18% | 14 | 12 | Cold storage, clean rooms | ISO 9001, ISO 45001 |
| PP-INT-004 | Tongue-and-Groove | 300 x 300 | 8 | PP | ≥ 3,500 hours | High | -15 to 60 | R10 | 0.40% | 8 | 5 | Laboratories, workshops | RoHS, REACH |
| PP-INT-005 | Herringbone | 400 x 400 | 10 | PP | ≥ 5,000 hours | Medium-High | -20 to 75 | R11 | 0.25% | 9 | 7 | Retail spaces | CE |
| PP-INT-006 | Grid Plus | 600 x 600 | 14 | PP reinforced | ≥ 7,000 hours | High | -25 to 90 | R12 | 0.20% | 16 | 15 | Rugged outdoor platforms | ISO 9001, ISO 14001 |
Related Products
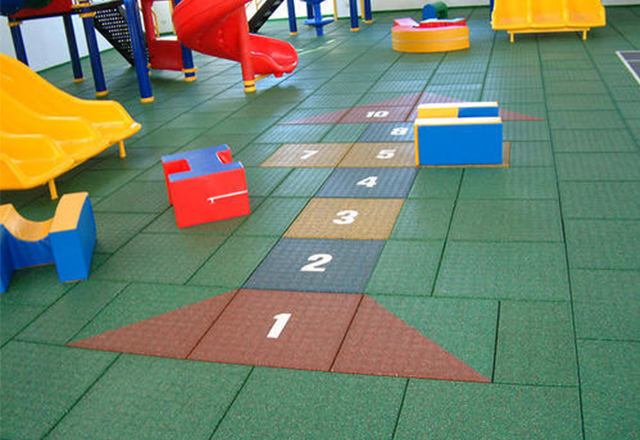
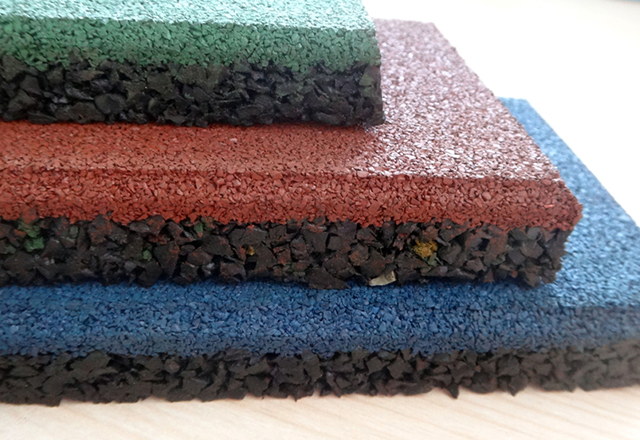
Outdoor Playground Safety Rubber Tiles | Impact-Absorbing Rubber Flooring for Playgrounds, Parks & Schools
Read More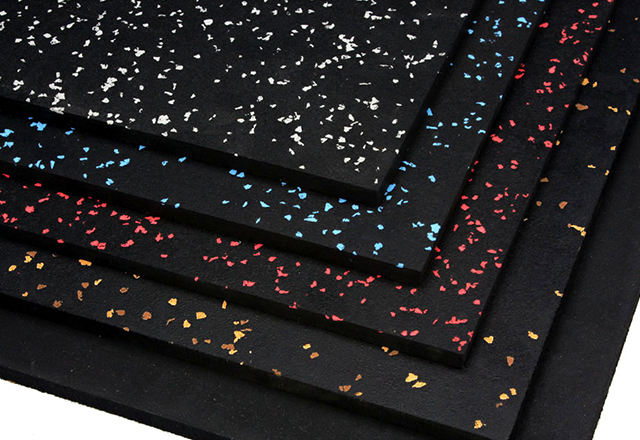
interlocking PP tiles Exceeds Industry Benchmarks Outperforms the Competition
Top Selling Products
- Related Blog
- Reviews
