
Wholesale Landscape Rubber Tiles from Manufacturers | Durable Outdoor
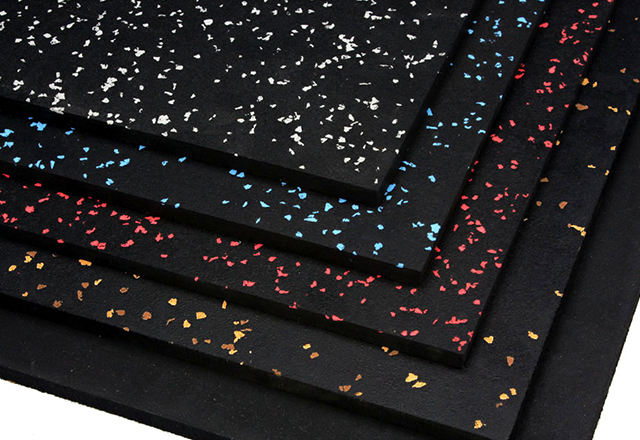
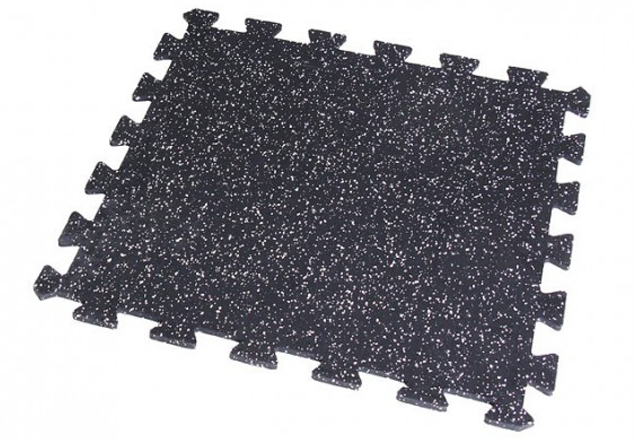
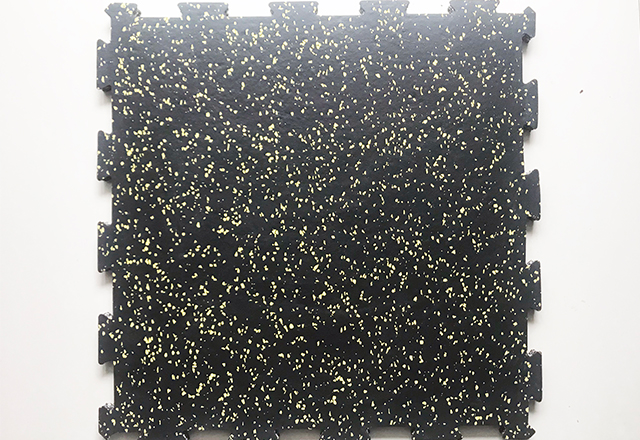
From a buyer’s perspective, I search for landscape rubber tiles that last, install fast, and ship on time. As a Wholesale supplier and Manufacturers of outdoor flooring, we offer durable landscape rubber tiles designed for parks, campuses, poolsides, and pedestrian pathways. Our tiles snap together with interlocking edges, creating seamless surfaces with excellent drainage and slip resistance. I personally test UV stability and weather resilience so they won't fade or crack in sun or freezing winters. They are made from recycled rubber, non-toxic, and easy to clean, low maintenance. For wholesale orders, our pricing is competitive and we can fulfill large volumes quickly, meeting tight project deadlines. We supply benefits for landscape designers, facility managers, and contractors seeking quick installation and a long lifecycle. If you're evaluating options, I source only top grade, I can arrange samples, and direct shipping from our factory to your site. Contact us today to discuss your project and get a quote.
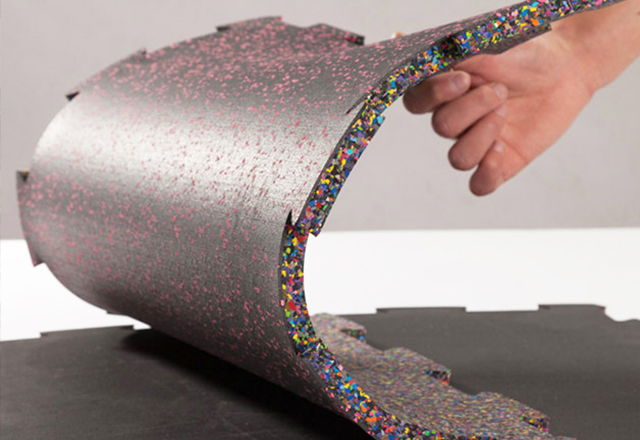
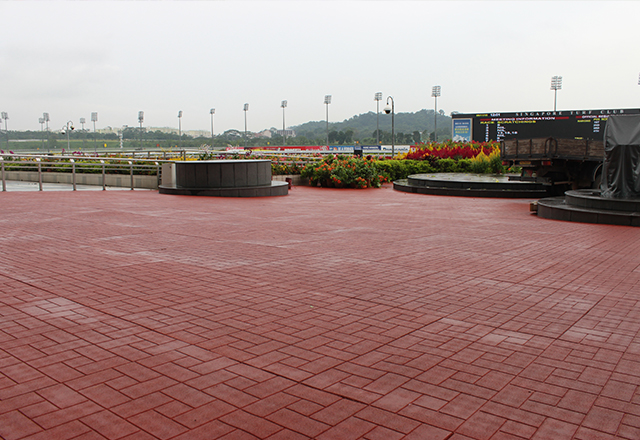
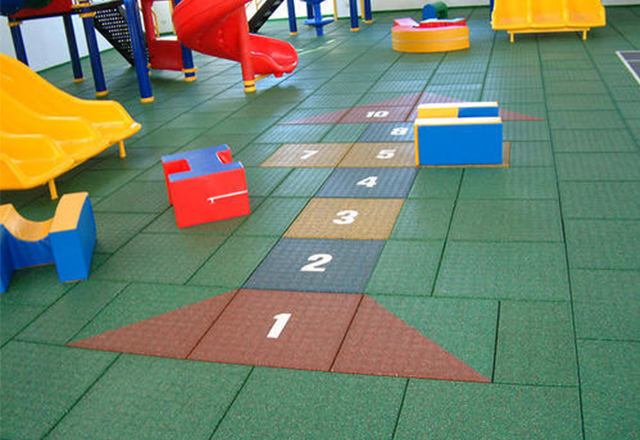
landscape rubber tiles Products Ahead of the Curve
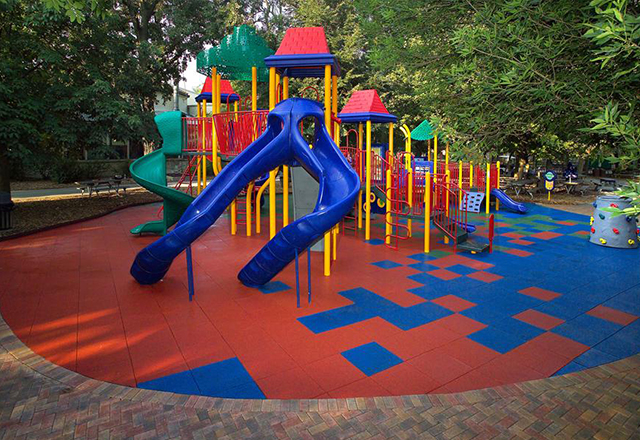
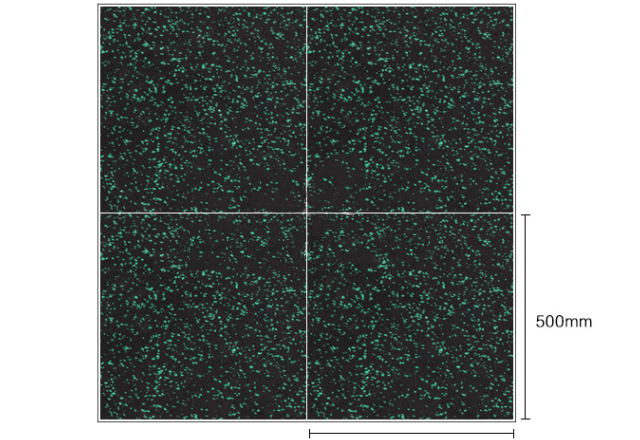
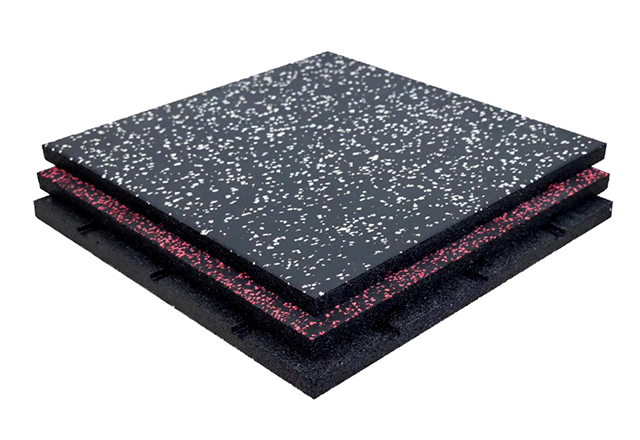
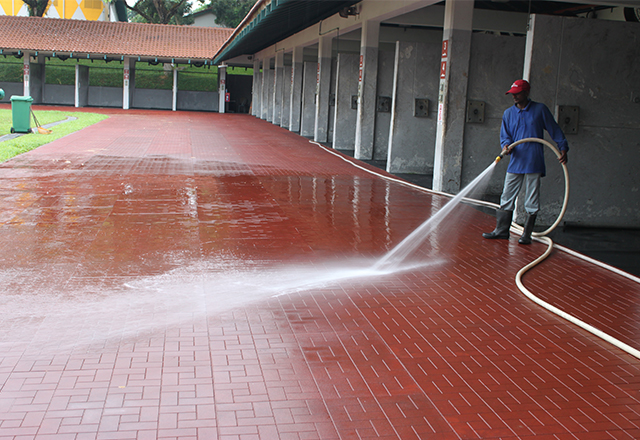
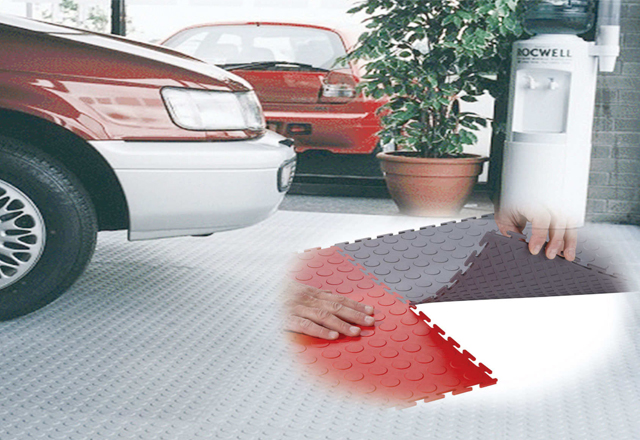
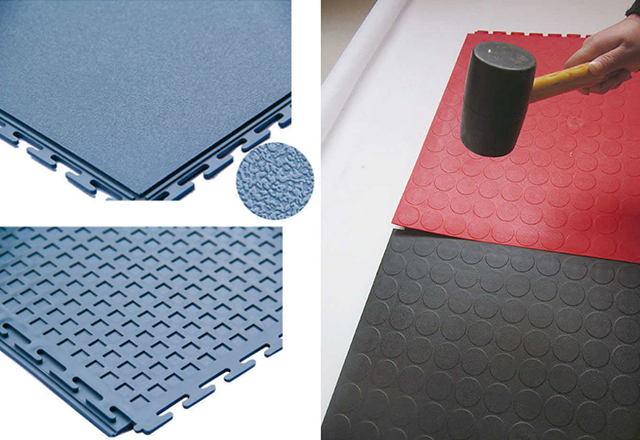
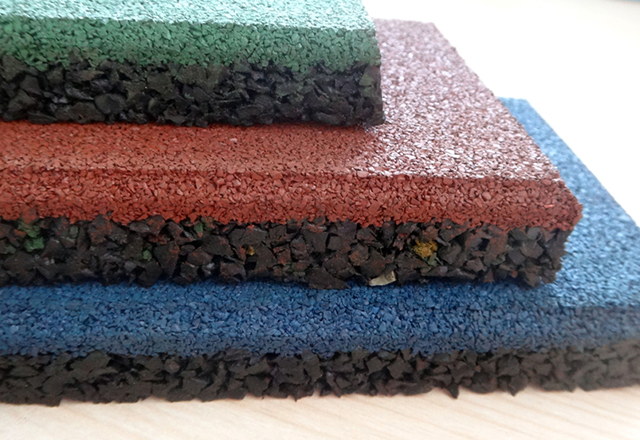
Landscape rubber tiles redefine outdoor spaces and are ahead of the curve in delivering reliable slip resistance, impact absorption, and adaptive drainage for high-traffic areas such as courtyards, playgrounds, rooftops, and pathways. UV-stable formulations resist fading and weathering, keeping colors vibrant for years while maintaining a soft, comfortable feel. Modular, interlocking designs simplify installation and repairs, enabling creative patterns that fit contemporary landscapes. These tiles are engineered to meet international performance benchmarks, delivering consistent quality across batches. Global buyers gain from scalable production, transparent materials sourcing, and eco-conscious composition that can include recycled content. Flexible sizing, color options, and textured tops offer brand-appropriate finishes without sacrificing performance. Competitive lead times, robust supply chains, and clear warranties support project timelines from parks to campuses. With installation guides and responsive after-sales support, buyers can plan confident rollouts across regions, knowing the tiles perform reliably in varied climates.
| Model | Tile Size (mm) | Thickness (mm) | Material Composition | Recycled Content (%) | Interlock Type | Surface Texture | Color Options | DCOF (Wet) | Outdoor Suitability | UV Stability (hours) | Certifications |
|---|---|---|---|---|---|---|---|---|---|---|---|
| Model A | 600 x 600 | 20 | 60% SBR, 40% EPDM | 65 | Top-Lock | Textured Grid | Black, Gray, Green | 0.48 | Outdoor & Playground | 5000 | REACH Compliant; CPSC FF-1 |
| Model B | 600 x 600 | 25 | 100% SBR | 70 | Edge-Lock | Ribbed | Black, Gray | 0.52 | Outdoor | 3500 | LEED v4 Eligible; GreenGuard Gold |
| Model C | 600 x 600 | 30 | 70% SBR, 30% EPDM | 75 | Interlocking Tile | Granular | Black, Green, Brown | 0.46 | Outdoor | 5000 | USC-CPSC; ISO 9001 |
| Model D | 600 x 600 | 40 | 80% SBR, 20% EPDM | 80 | Locking + Edge | Smooth | Black | 0.50 | Outdoor | 4800 | REACH; RoHS |
| Model E | 600 x 600 | 20 | 55% SBR, 45% EPDM | 60 | Floating Lock | Checker | Red, Black | 0.42 | Outdoor | 4500 | LEED v4; GreenGuard Gold |
Related Products
landscape rubber tiles Delivers Unmatched Quality From Concept to Delivery
Top Selling Products
- Related Blog
- Reviews
