
Rubber Garden Pavers | China Manufacturer | High-Quality Outdoor Tiles
As a China-based manufacturer, I deliver rubber garden pavers that combine safety, durability and easy maintenance for commercial landscapes. Our rubber garden pavers are designed to withstand heavy foot traffic and resist weathering, making them ideal for hotels, shopping centers, residential complexes and parkways. I source premium natural rubber and recycled materials to craft interlocking tiles that are skid resistant, noise reducing and slip resistant. The modular system installs quickly without mortar, reducing project timelines and labor costs for buyers in China and abroad. We offer a range of colors and textures to match brand standards and outdoor aesthetics. Each batch comes with quality certificates and is tested for UV stability and load bearing. Let me know your project size and we’ll tailor a quote with bulk discounts and fast lead times. I am dedicated to reliable service and steady supply for your next outdoor flooring project.
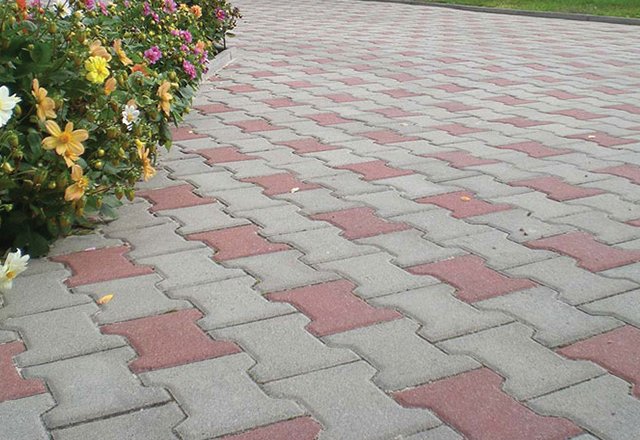
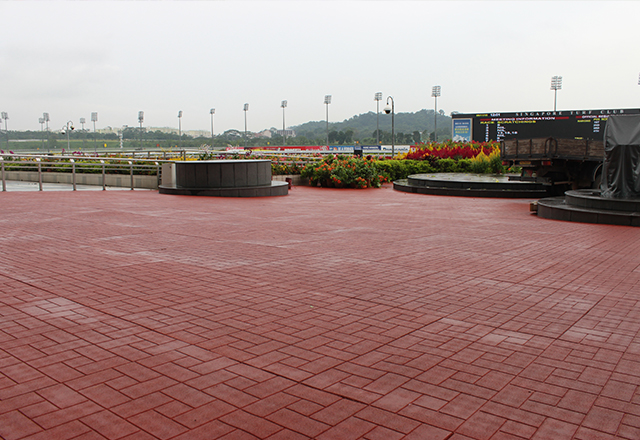
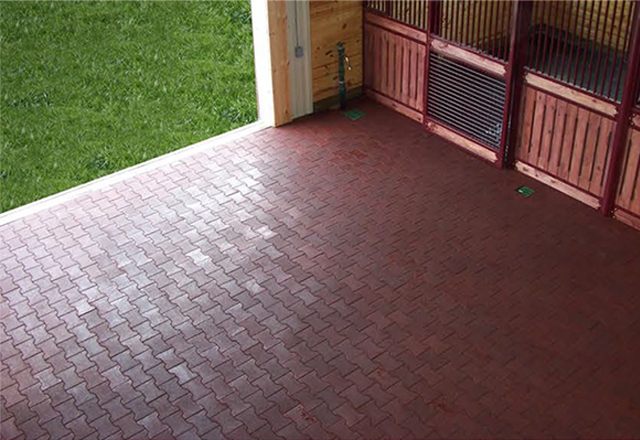
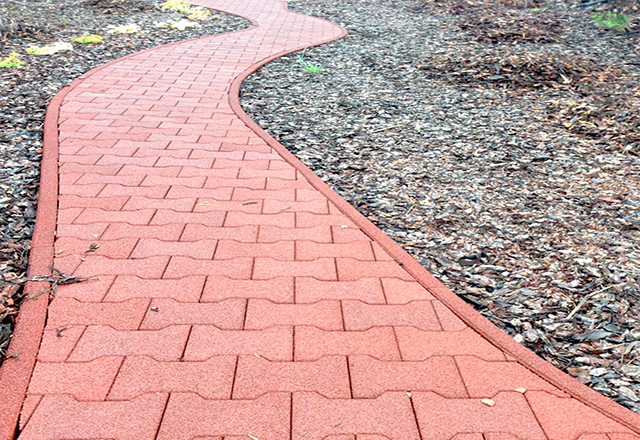
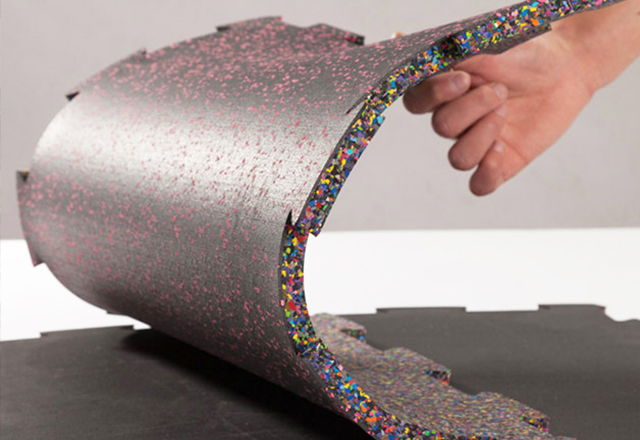
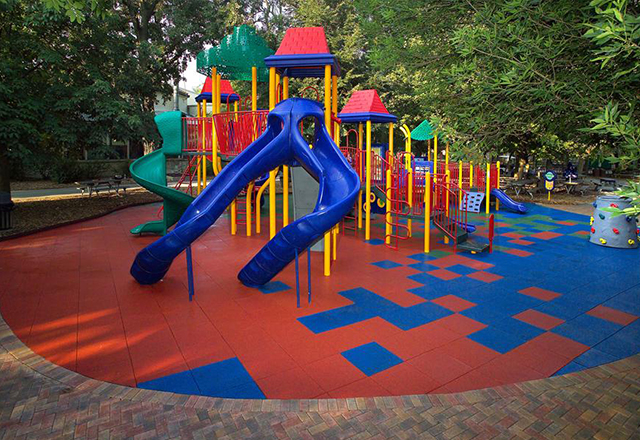
rubber garden pavers Winning in 2025 Custom Solutions,
As global procurement eyes 2025, rubber garden pavers are redefining outdoor spaces with durability and design flexibility. Their resistance to UV, freeze-thaw, and heavy foot traffic makes them ideal for hotels, campuses, parks, and homes. The winning mix combines slip resistance, long-lasting color, and easy maintenance, while enabling bespoke layouts that fit any terrain. Custom solutions meet site-specific needs: adjustable thickness, modular patterns, textured finishes, and integrated drainage. They can be paired with irrigation and lighting, and can use recycled content to boost sustainability. With faster production and scalable options, buyers move from concept to installation without compromising quality or schedule. To secure reliable supply, evaluate suppliers on certifications, traceability, MOQ flexibility, lead times, and after-sales support. Request performance data, installation guidance, and warranties. A partner offering end-to-end support—from design optimization to packaging and logistics—reduces risk and delivers consistent results across global projects.
rubber garden pavers Winning in 2025 Custom Solutions
| Scenario | Tile Size (cm) | Thickness (mm) | Material Blend | Recycled Content (%) | Load Rating (kN) | DCOF Wet | Color Retention (1000h, %) | Temperature Range (C) | Drainage Rate (L/s/m²) | Installation Method | Maintenance | Warranty (years) | Carbon Footprint (kg CO2e/m²) |
|---|---|---|---|---|---|---|---|---|---|---|---|---|---|
| Residential Patio - Low-traffic | 30 x 30 | 20 | Recycled EPDM + SBR | 60 | 2.5 | 0.52 | 95 | -20 to 60 | 0.75 | Interlocking with base | Low - occasional cleaning | 15 | 3.2 |
| Outdoor Walkway - Moderate Traffic | 40 x 40 | 22 | Virgin rubber + filler | 40 | 3.0 | 0.58 | 93 | -25 to 65 | 0.85 | Mortar-free with compacted subbase | Annual wash | 10 | 3.8 |
| Poolside Decking - Wet area | 50 x 50 | 25 | Recycled EPDM + cork filler | 70 | 3.5 | 0.60 | 92 | -18 to 62 | 1.0 | Interlocking with subframe | Occasional vacuum | 12 | 4.0 |
| Rooftop Terrace - Dry heat | 45 x 45 | 22 | Recycled rubber composite | 65 | 3.2 | 0.55 | 90 | -15 to 55 | 0.9 | Perimeter frame | Clean drains | 10 | 3.6 |
| Playground Safety Area | 30 x 30 | 20 | High-density recycled rubber | 80 | 4.0 | 0.65 | 88 | -25 to 60 | 0.70 | Interlocking | Seasonal | 12 | 3.5 |
| Balcony Edge Cover | 25 x 25 | 18 | Composite rubber with silica | 50 | 2.2 | 0.50 | 97 | -30 to 50 | 0.6 | Adhesive with edge trim | Wipe occasionally | 8 | 2.9 |
| Garden Path - Frost resistant | 60 x 60 | 28 | Hybrid rubber + basalt filler | 60 | 3.8 | 0.54 | 96 | -20 to 70 | 1.2 | Sub-base + interlock | Brush as needed | 15 | 4.2 |
Related Products
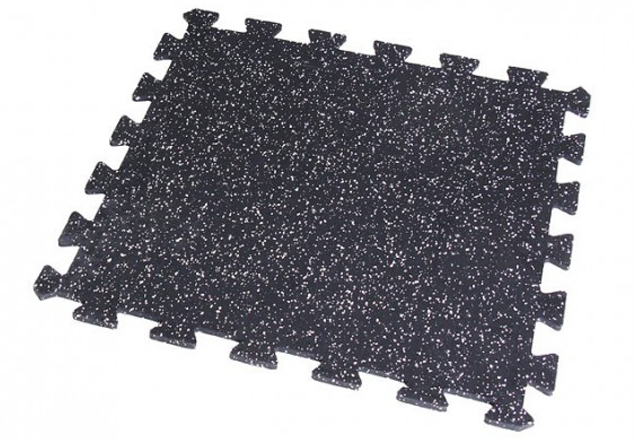
rubber garden pavers Where Innovation Meets 2025 Factory-Direct Excellence
Top Selling Products
- Related Blog
- Reviews
