
China Rubber Playground Tiles Manufacturer - Durable Surface Tiles
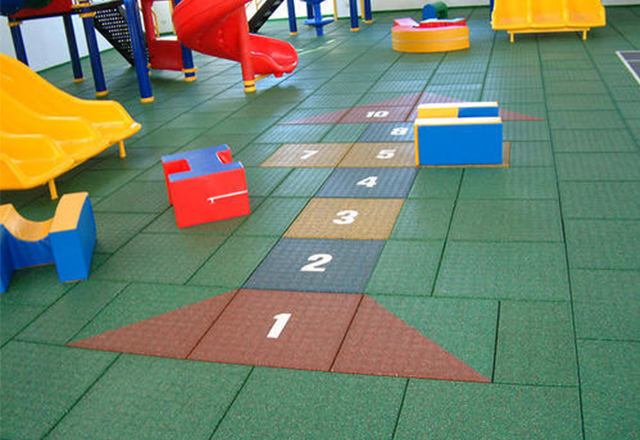
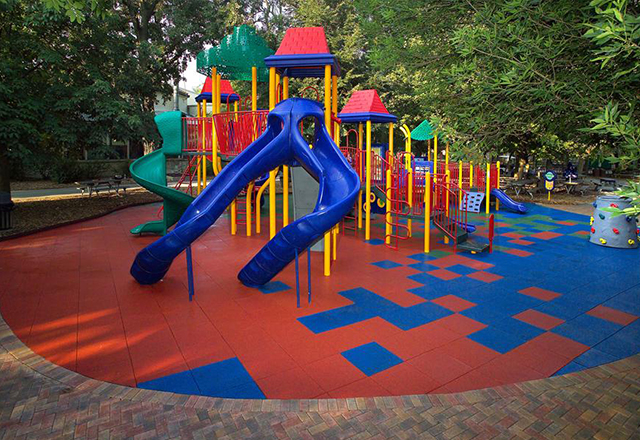
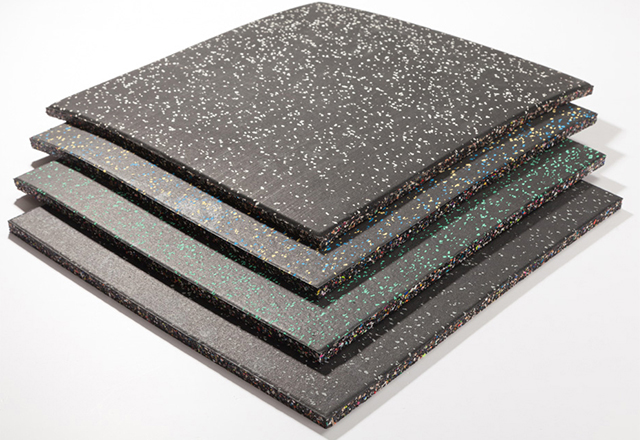
As a China-based Manufacturer, I offer durable rubber playground tiles designed for heavy traffic and real-world playgrounds. I know what B2B buyers need: safety, quick installation, and reliable supply at scale. Our rubber playground tiles are non-slip, UV-stable, and shock-absorbent, providing better fall protection for kids and less maintenance for you. They are modular and interlock, so you can cover curved surfaces or full playgrounds without mess. I provide customization—colors, thickness, and surface textures—to match your local standards and branding. With strict QC and certified materials, you get consistent quality batch after batch. I manage production and logistics to ensure on-time delivery to your site. If you’re searching for a trustworthy China-based Manufacturer who can grow with your orders, let’s talk about your project, quantities, and lead times.
rubber playground tiles Now Trending More Than a Supplier - A Partner
As the market shifts from simply supplying to forming partnerships, buyers seek reliable, scalable solutions. Rubber playground tiles deliver more than a surface: they offer predictable performance across climates and high-traffic sites, with weather resistance, UV stability, slip resistance, and cushioning that reduces injuries. For global procurement, modular, standardized systems speed deployment, simplify logistics, and ensure consistent quality across regions. Colorful, configurable layouts support inclusive design and compliance with diverse safety standards. True partnerships go beyond product specs with engineering support, installation guidance, and transparent documentation. A collaborative supplier provides testing data, manuals, and reliable after-sales service, reducing rollout risk for multinational projects. Consider lifecycle costs—durability, maintenance, and recyclable content—to optimize total cost of ownership while enhancing sustainability. With continuity, risk mitigation, and a shared commitment to safety and accessibility, such collaborations help global buyers scale their playground programs confidently.
{ rubber playground tiles Now Trending More Than a Supplier - A Partner}
| Region | Tile Size (mm) | Material Type | Thickness (mm) | Typical Applications | Installation Method | Safety Certifications | Durability (years) | Annual Demand (million tiles) | Growth Rate (%) | Recyclability (%) | UV Resistance | Notes |
|---|---|---|---|---|---|---|---|---|---|---|---|---|
| North America | 600 x 600 | SBR/EPDM blend | 15 | Playgrounds, Schools, Recreational parks | Tongue-and-groove interlocking | ASTM F1292, CPSC guidelines | 12 | 8.2 | 5.4 | 85 | Excellent | Preferred for new builds; good drainage |
| Europe | 500 x 500 | EPDM | 20 | Public playgrounds, Urban parks | Loose lay over underlayment | EN 1177, EN 71 | 13 | 6.1 | 6.2 | 88 | Excellent | Higher color longevity |
| Asia-Pacific | 600 x 600 | SBR | 15 | Community centers, Daycare centers | Interlocking tiles | ASTM F1292, EN 1177 | 10 | 9.4 | 4.8 | 82 | Good | High demand in rainfall regions |
| Latin America | 500 x 500 | EPDM/SBR mix | 12 | School playgrounds | Glue-down or interlocking | ASTM F1292 | 11 | 3.8 | 5.5 | 78 | Good | Cost-sensitive markets |
| Middle East & Africa | 400 x 400 | EPDM | 12 | Public parks | Interlocking | ASTM F1292 | 9 | 2.9 | 7.1 | 76 | Excellent | Heat resistance important |
| Rest of World | 600 x 600 | SBR/EPDM mix | 16 | Fitness areas, Resorts | Interlocking | ASTM F1292, EN 1177 | 12 | 4.5 | 5.0 | 80 | Good | Emerging markets in developing regions |
Related Products
rubber playground tiles Your End-to-End Solution More Than a Supplier - A Partner
Top Selling Products
- Related Blog
- Reviews
