
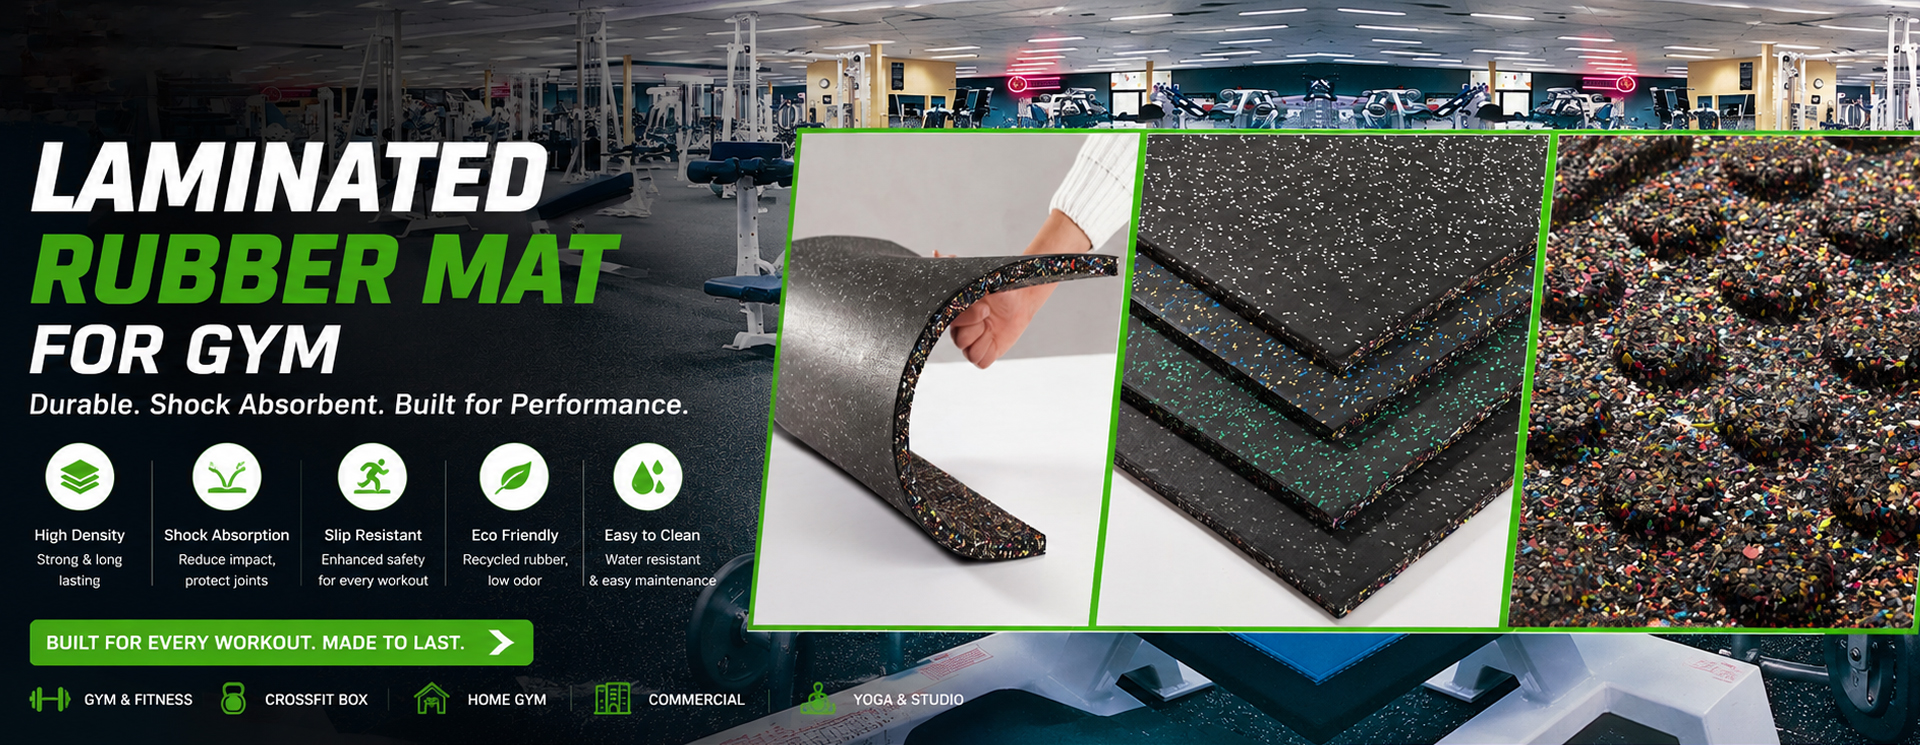
China Manufacturer - Horse Stable Rubber Tiles for Durable Flooring
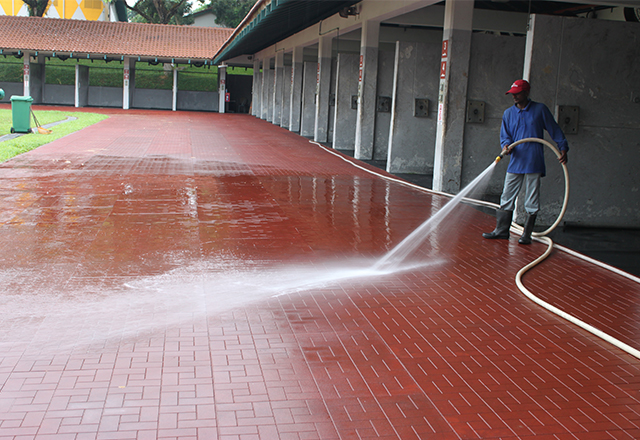
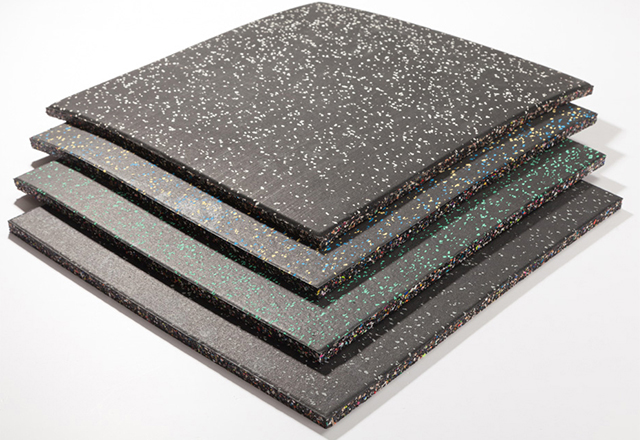
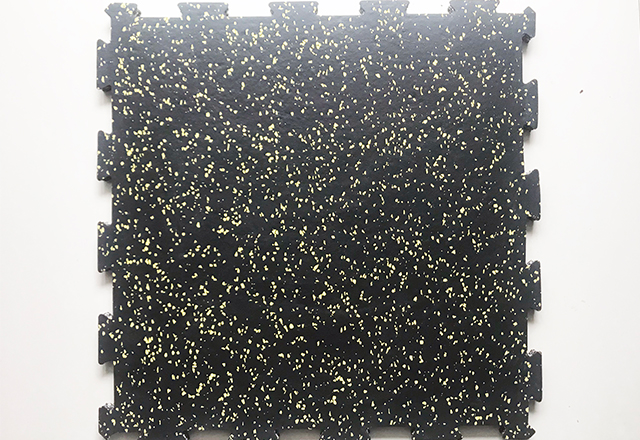
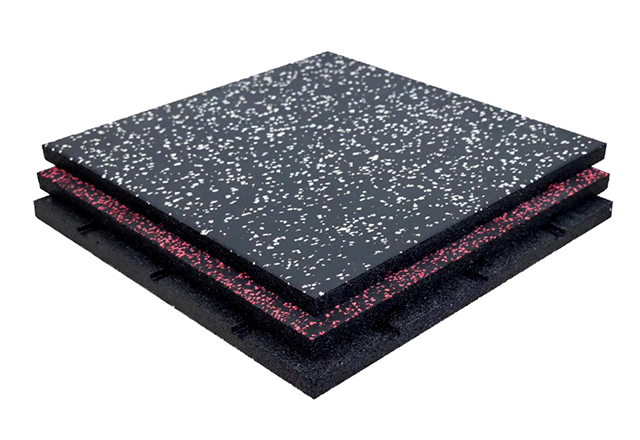
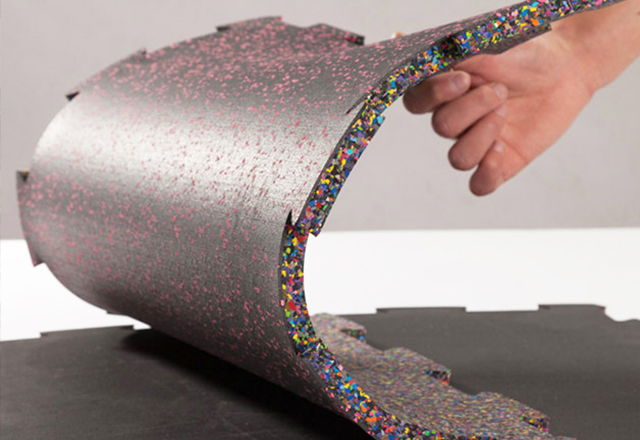
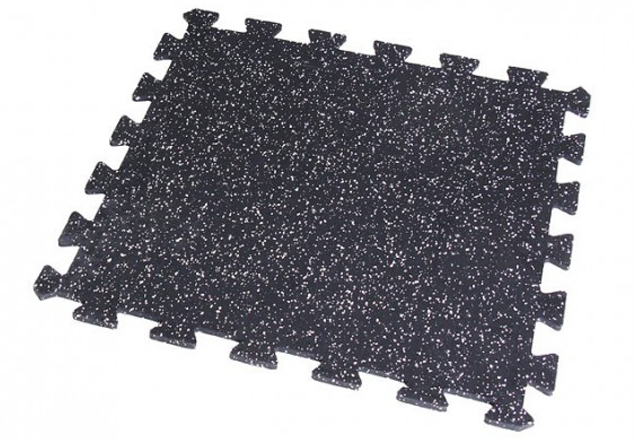
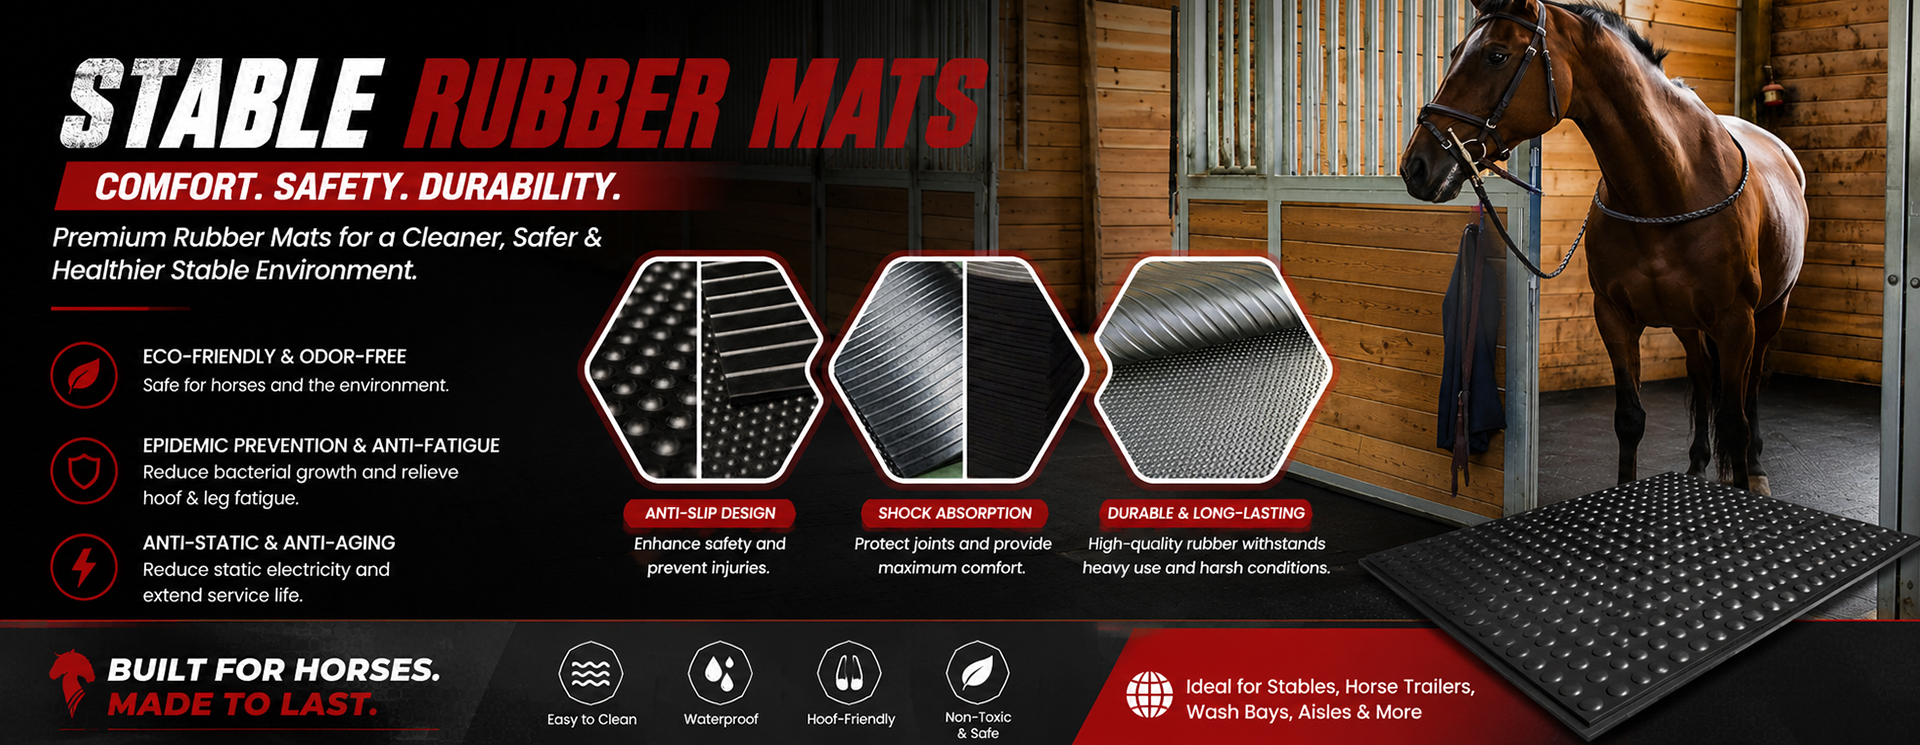
From a China-based manufacturer, I bring you horse stable rubber tiles that stand up to daily riding and stall life. These tiles are designed for durability, slip resistance, and easy cleaning in busy barns. Interlocking edges create a seamless floor with drainage channels to prevent water and urine buildup, keeping stalls dry and odor-free. Made from recycled rubber, our horse stable rubber tiles are non-toxic, UV-stable, and resistant to chemicals from cleaners. They cushion joints, reduce leg strains, and reduce noise for calmer horses. Installation is quick—no special tools needed—just lay and lock. We offer customizable sizes and thicknesses to fit any stall layout, with fast shipping from our factory in China to your facility. As a manufacturer, I stand behind quality with competitive pricing, scalable for large orders, and dedicated support for B2B buyers worldwide.
horse stable rubber tiles Factory Industry Giant
As a factory-scale industry leader in horse stable rubber tiles, we combine high-volume production with rigorous quality control to serve global buyers seeking durable, safe, and cost-effective flooring solutions. Our tiles are manufactured from premium recycled and virgin rubber blends, offering superior shock absorption, non-slip grip, odor control, and weather resistance. Fully customizable in thickness, size, and color, they meet international standards for livestock safety and hygiene and are produced under strict ISO and environmental certifications. From OEM/ODM capabilities to streamlined export logistics, we support large-scale projects with competitive pricing, short lead times, and comprehensive pre- and post-sales engineering support. Buyers benefit from end-to-end factory integration—sampling, production monitoring, packing for ocean freight, and warranty-backed performance—making it easy to specify and deploy stable flooring that improves animal welfare, reduces maintenance, and delivers long-term value.
| Product Type | Tile Size (mm) | Thickness (mm) | Material Composition | Density (g/cm³) | Hardness (Shore A) | Impact Absorption (%) | Thermal Conductivity (W/m·K) | Water Absorption (%) | Fire Rating | Typical Applications | Typical Factory Output (m²/month) |
|---|---|---|---|---|---|---|---|---|---|---|---|
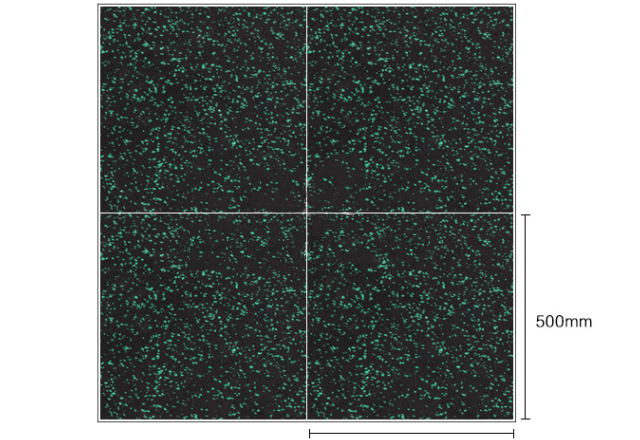
| Recycled SBR bonded tile | 500 × 500 | 20 | Recycled SBR granules + polyurethane binder | 1.10 | 65 | 60 | 0.18 | 0.8 | Cfl‑s1 | Stable aisles Grooming areas | 22,000 |
| Vulcanized interlocking tile | 600 × 600 | 25 | Vulcanized rubber; EPDM surface option | 1.20 | 70 | 55 | 0.20 | 0.5 | Bfl‑s1 | Training arenas Wash bays | 18,000 |
| EPDM‑infused large panel | 1000 × 1000 | 40 | EPDM blend with recycled rubber core | 1.05 | 60 | 70 | 0.16 | 0.4 | Cfl‑s1 | Stalls Turnout walkways | 12,000 |
| Natural rubber composite | 500 × 500 | 30 | Natural rubber with textile reinforcement | 0.95 | 55 | 75 | 0.14 | 0.3 | Bfl‑s1 | Foaling areas Comfort stall mats | 8,000 |
| High‑density bonded tile | 1000 × 1000 | 50 | High‑density SBR with polyurethane binder | 1.25 | 80 | 45 | 0.22 | 1.5 | Cfl‑s1 | Heavy‑traffic aisles Loading areas | 15,000 |
| Perforated drainage tile (recycled) | 600 × 600 | 25 | Recycled rubber mix with engineered perforations | 1.10 | 68 | 65 | 0.19 | 1.0 | Cfl‑s1 | Wash bays Outdoor walkways | 14,500 |
Related Products
horse stable rubber tiles Winning in 2025 Service Backed by Expertise
Top Selling Products
- Related Blog
- Reviews
