
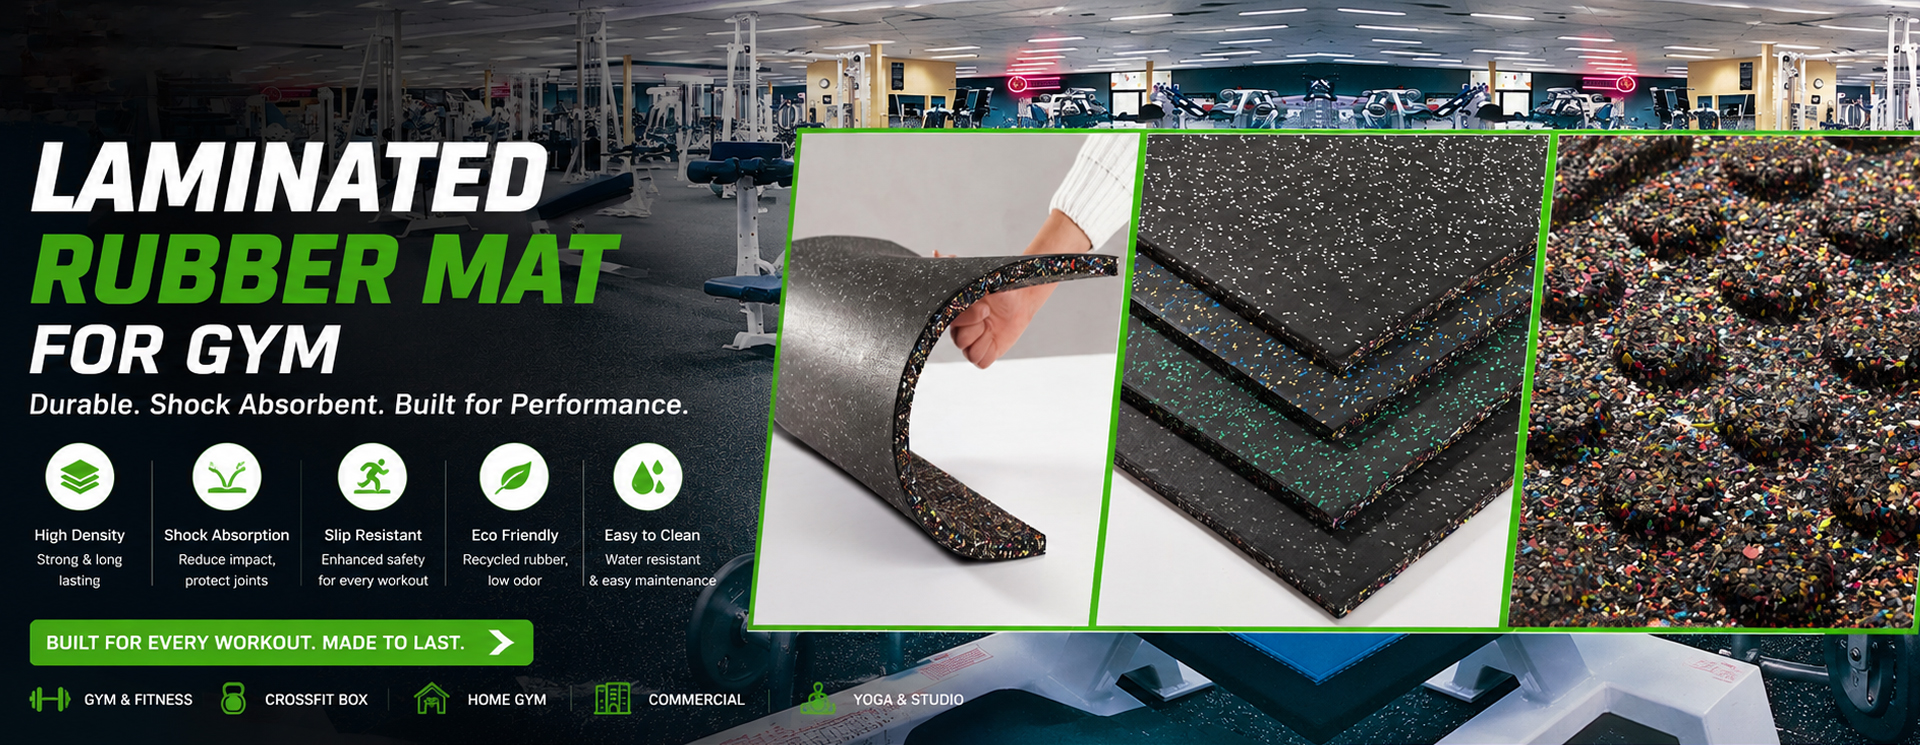
Industrial Workshop Flooring - Wholesale Manufacturers
We help wholesale buyers and manufacturers upgrade their facilities with durable industrial workshop flooring. We design solutions that stand up to heavy traffic, chemicals, and dropped tools, so downtime is minimized and safety stays high. Our range covers epoxy and polyurethane systems, reinforced concrete overlays, and seamless monolithic floors that resist abrasion and slip. We offer customizable thickness, color, and surface textures to fit your workflow, line layout, and cleanliness requirements. With fast response times and bulk pricing, we work with you from initial spec to installation, ensuring quick turnarounds and predictable budgeting for Wholesale orders or long-term Manufacturers projects. Each install comes with tested performance data, cure schedules, and on-site support to reduce risk. When you choose our industrial workshop flooring, you’re investing in lasting value, easier maintenance, and a better working environment for crews. Contact us for samples, certifications, and a tailored quote today.
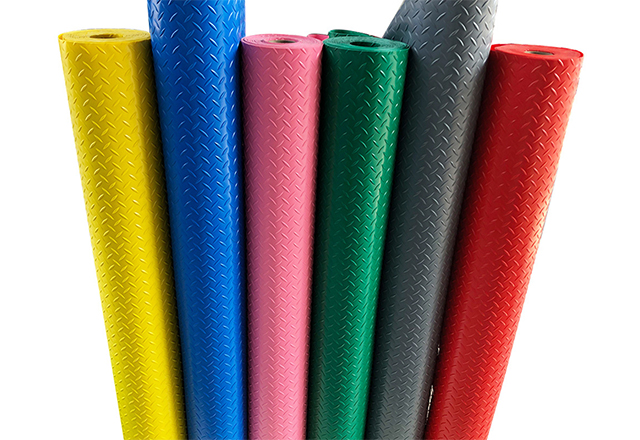
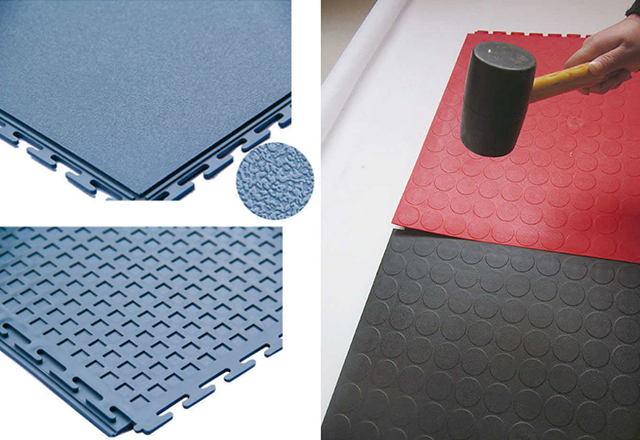
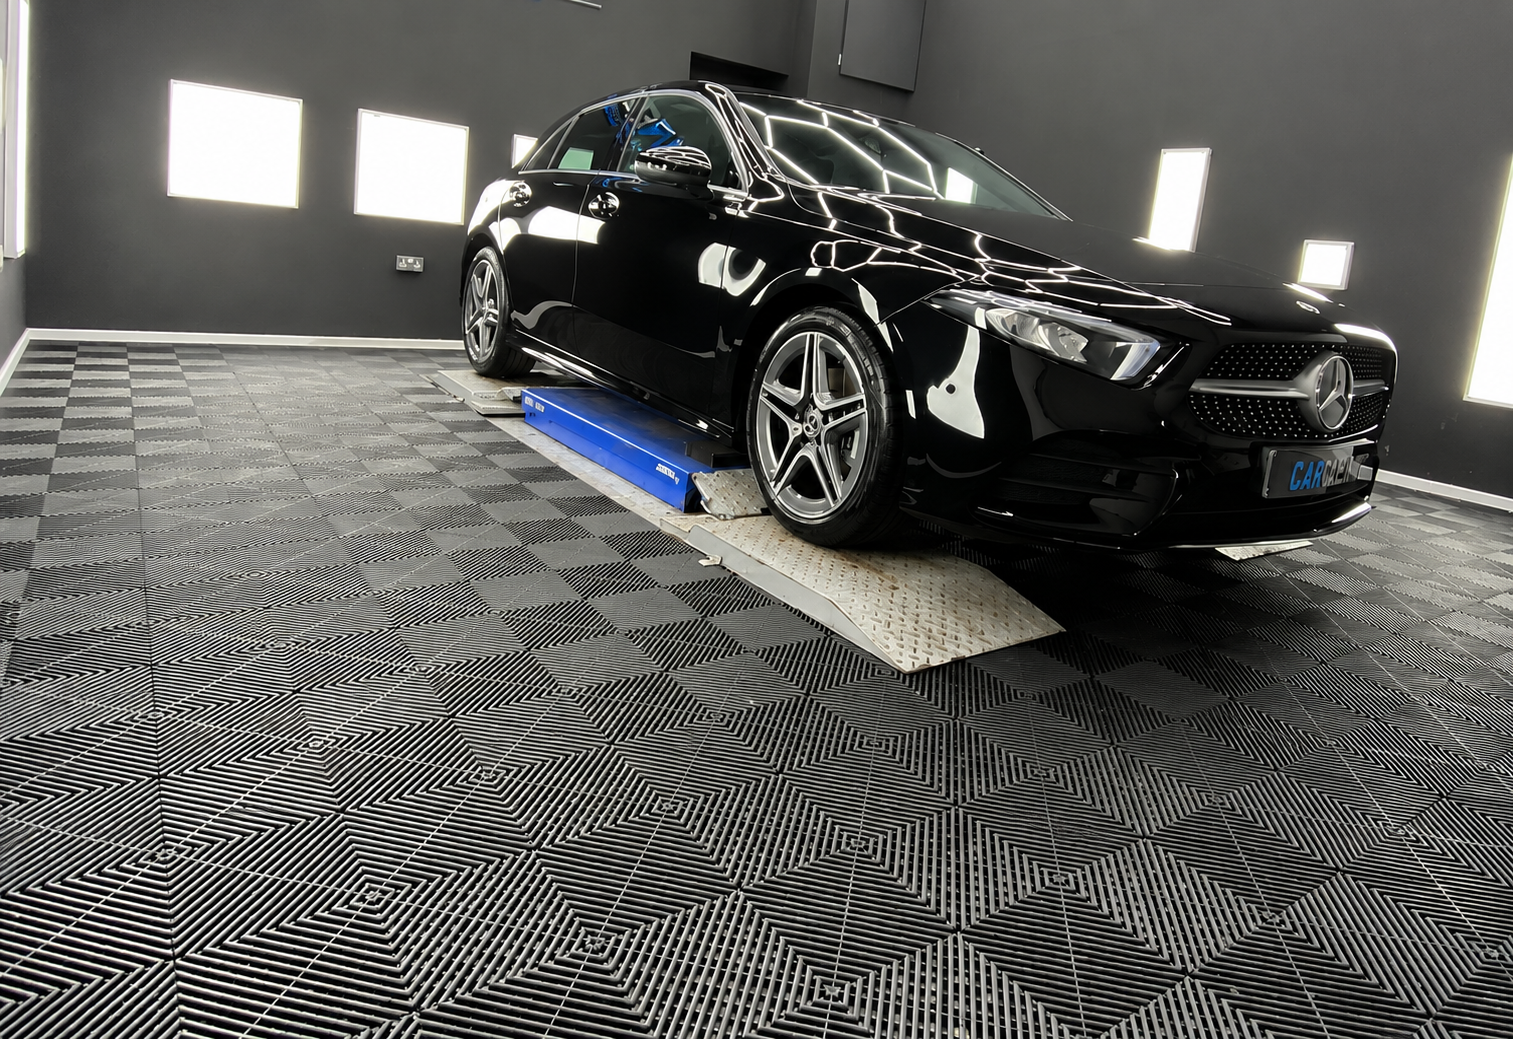
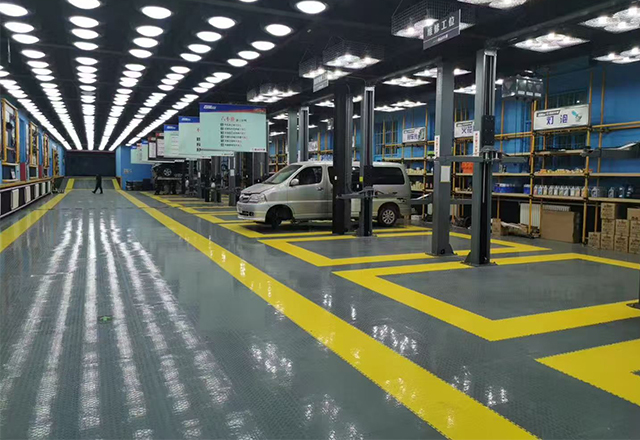
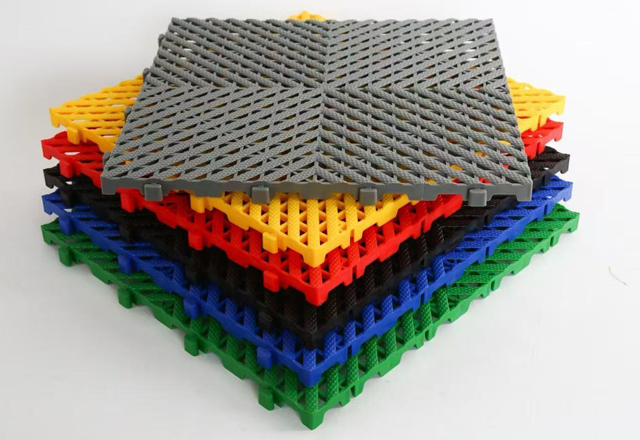
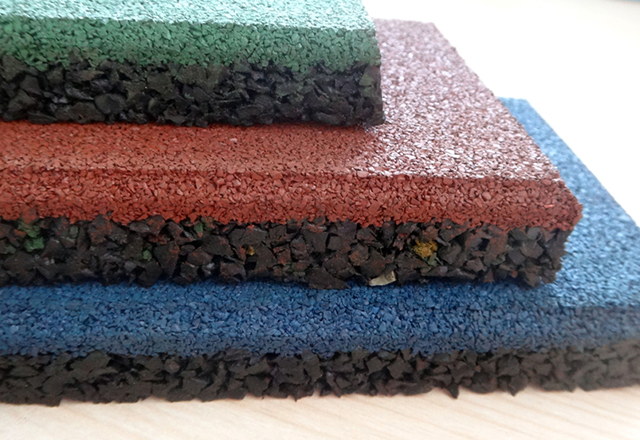
industrial workshop flooring Manufacturer From Concept to Delivery
From concept to installation, industrial workshop flooring is a multi-stage journey shaped by global operations. It begins with a concise needs assessment: expected loads, chemical exposure, temperature range, slip resistance, and cleanability. Based on these criteria, designers propose material options such as epoxy, polyurethane, or rubber-based systems, with performance data and practical installation steps. Small-scale prototypes and trials verify durability and maintenance needs before a full deployment. After design approval, production follows strict process controls, with batch traceability and adherence to international standards. Scheduling, logistics, on-site application, and curing are managed to ensure on-time delivery and minimal downtime. Post-installation support includes warranties, maintenance guidance, and operator training, while ongoing optimization, safety, and sustainability considerations meet the evolving demands of global sites.
| Product ID | System Type | Substrate | Top Layer / Finish | Thickness (mm) | Cure Time (days) | Compressive Strength (MPa) | Chemical Resistance | Temperature Range (°C) | Slip Resistance (COF Dry/Wet) | Warranty (years) | Lead Time (weeks) |
|---|---|---|---|---|---|---|---|---|---|---|---|
| EPX-0101 | Epoxy Resin Floor | Concrete | Quartz-filled epoxy with aggregate | 3.0 | 3 | 60 | Excellent against solvents, acids, alkalis | -20 to 120 | COF Dry 0.65 / Wet 0.50 | 15 | 4 |
| PUF-0202 | Polyurethane Cement | Concrete | Smooth polyurethane topcoat | 5.0 | 2 | 45 | Very good chemical resistance to solvents and acids | -40 to 120 | COF Dry 0.70 / Wet 0.55 | 12 | 5 |
| MMA-0303 | Methyl Methacrylate Floor | Concrete | UV-stable MMA topcoat | 2.5 | 1 | 42 | Excellent for fast cure and impact resistance | -20 to 70 | COF Dry 0.60 / Wet 0.45 | 8 | 3 |
| ESD-0404 | Antistatic Epoxy/PU | Concrete | Conductive topcoat with carbon-filled polymer | 4.0 | 3 | 40 | Electrical resistance control; suitable for ESD | -30 to 90 | COF Dry 0.60 / Wet 0.50 | 10 | 4 |
| CST-0505 | Cementitious Self-Leveling | Concrete | Sealed anti-dust finish | 6.0 | 2 | 50 | Moderate chemical resistance; easy cleaning | -40 to 60 | COF Dry 0.68 / Wet 0.54 | 12 | 6 |
| PUA-0606 | Polyaspartic | Concrete | Aliphatic polyaspartic topcoat | 3.5 | 0.5 | 50 | Excellent UV and chemical resistance | -30 to 130 | COF Dry 0.70 / Wet 0.55 | 15 | 4 |
| HYB-0707 | Hybrid Epoxy/PU Floor | Concrete | Hybrid topcoat with quartz | 3.5 | 2 | 46 | Balanced chemical resistance; good wear | -20 to 110 | COF Dry 0.65 / Wet 0.50 | 10 | 5 |
Related Products
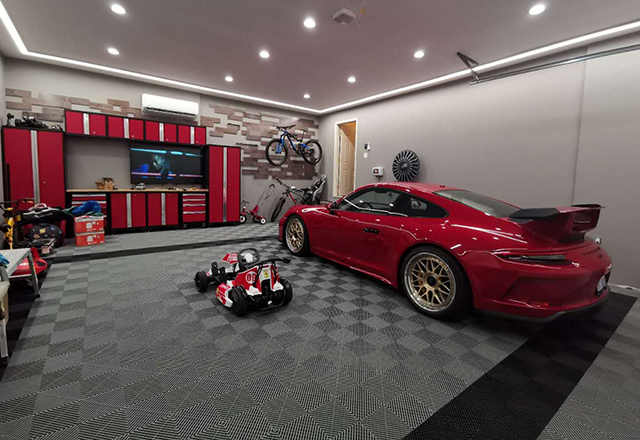
industrial workshop flooring Industry Leaders Sets the Industry Standard
Top Selling Products
- Related Blog
- Reviews
